Seven Days | data portraits
Seven Days is an ongoing project where I gather volunteers’ unique stories as data-sets and explore new ways of visualizing them through drawing. I work with participants to examine how art might overcome the limitations of language to adequately tell our stories. I aim to build intimacy in times of both physical and psychological isolation by fleshing out the personal nature of information. Together, we discover art as a tool for knowing ourselves and each other.
This project is generously supported by the Canada Council for the Arts.
We’re used to seeing information presented visually in charts and diagrams. I’m offering a different system, based on the same principles but with visual outcomes that are unique to each person.
Project 1 / Sarah + Tom
When words fail, can drawings fill the gap?
I began drawing this project in the Fall of 2019 in an effort to build self-awareness. Faced with mental health challenges I could no longer ignore, I was struggling to explain, even to myself, what was happening in my mind. I had recently discovered the data visualization work of Giorgia Lupi and was drawn to her methodology. In her work, she integrates art and data to investigate how we experience the world. With this in mind, I embarked on my own experiment.
If art, as an expression information, can build insight… what about building connection?
My aim was to build a mirror in which to see myself more clearly. It occurred to me that the project would gain context if I did it alongside someone else. I invited my partner, Tom, to participate. After seventeen years of relating we were having a hard time seeing one another, and I wondered if this mirror I was building for myself could also be a window.
-
The process is a balancing act between design and discovery.
The work would be examining our perceptions, so it was important to me that we track subjective information. I was eager to explore how qualitative data would appear, moving through linear time. Together, Tom and I came up with a list of data points that impact the quality of our days - markers like energy level, resilience, and feelings of delight or despair.
I created a simple system for us to keep track of our information throughout the day. It had to be something that was easy to use and at our fingertips. I chose to make small paper booklets in which we recorded our seven days.
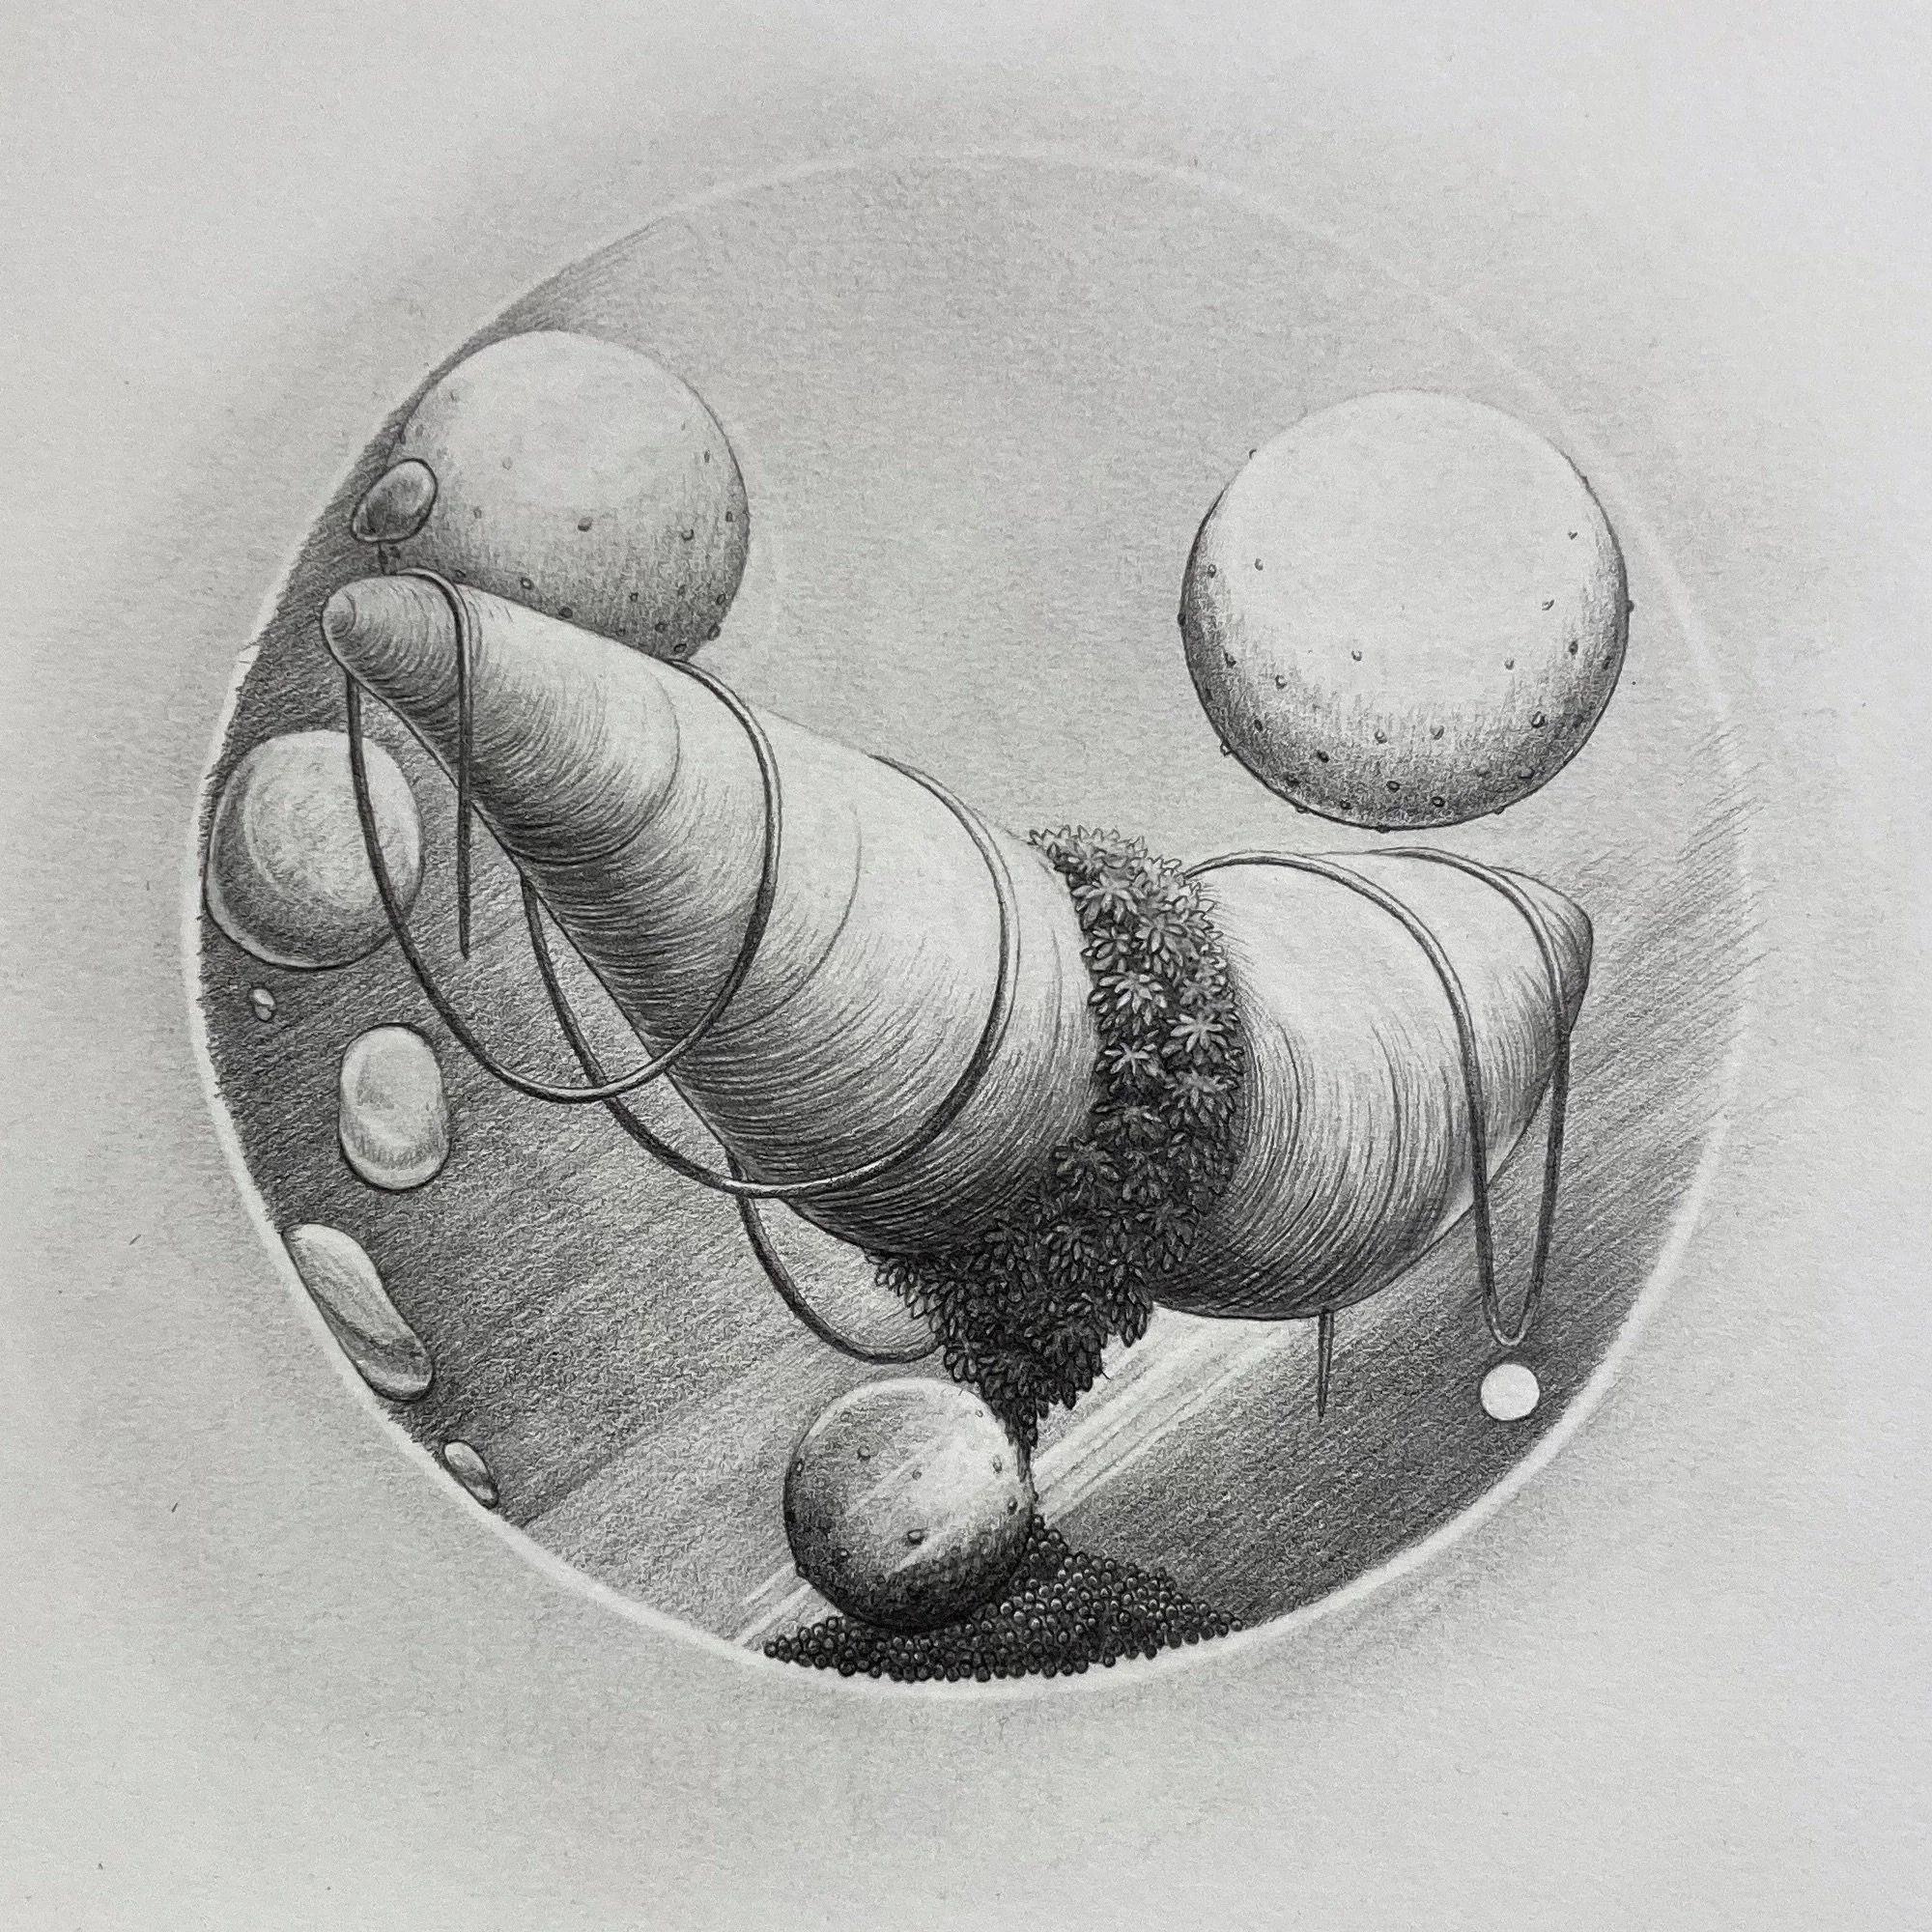
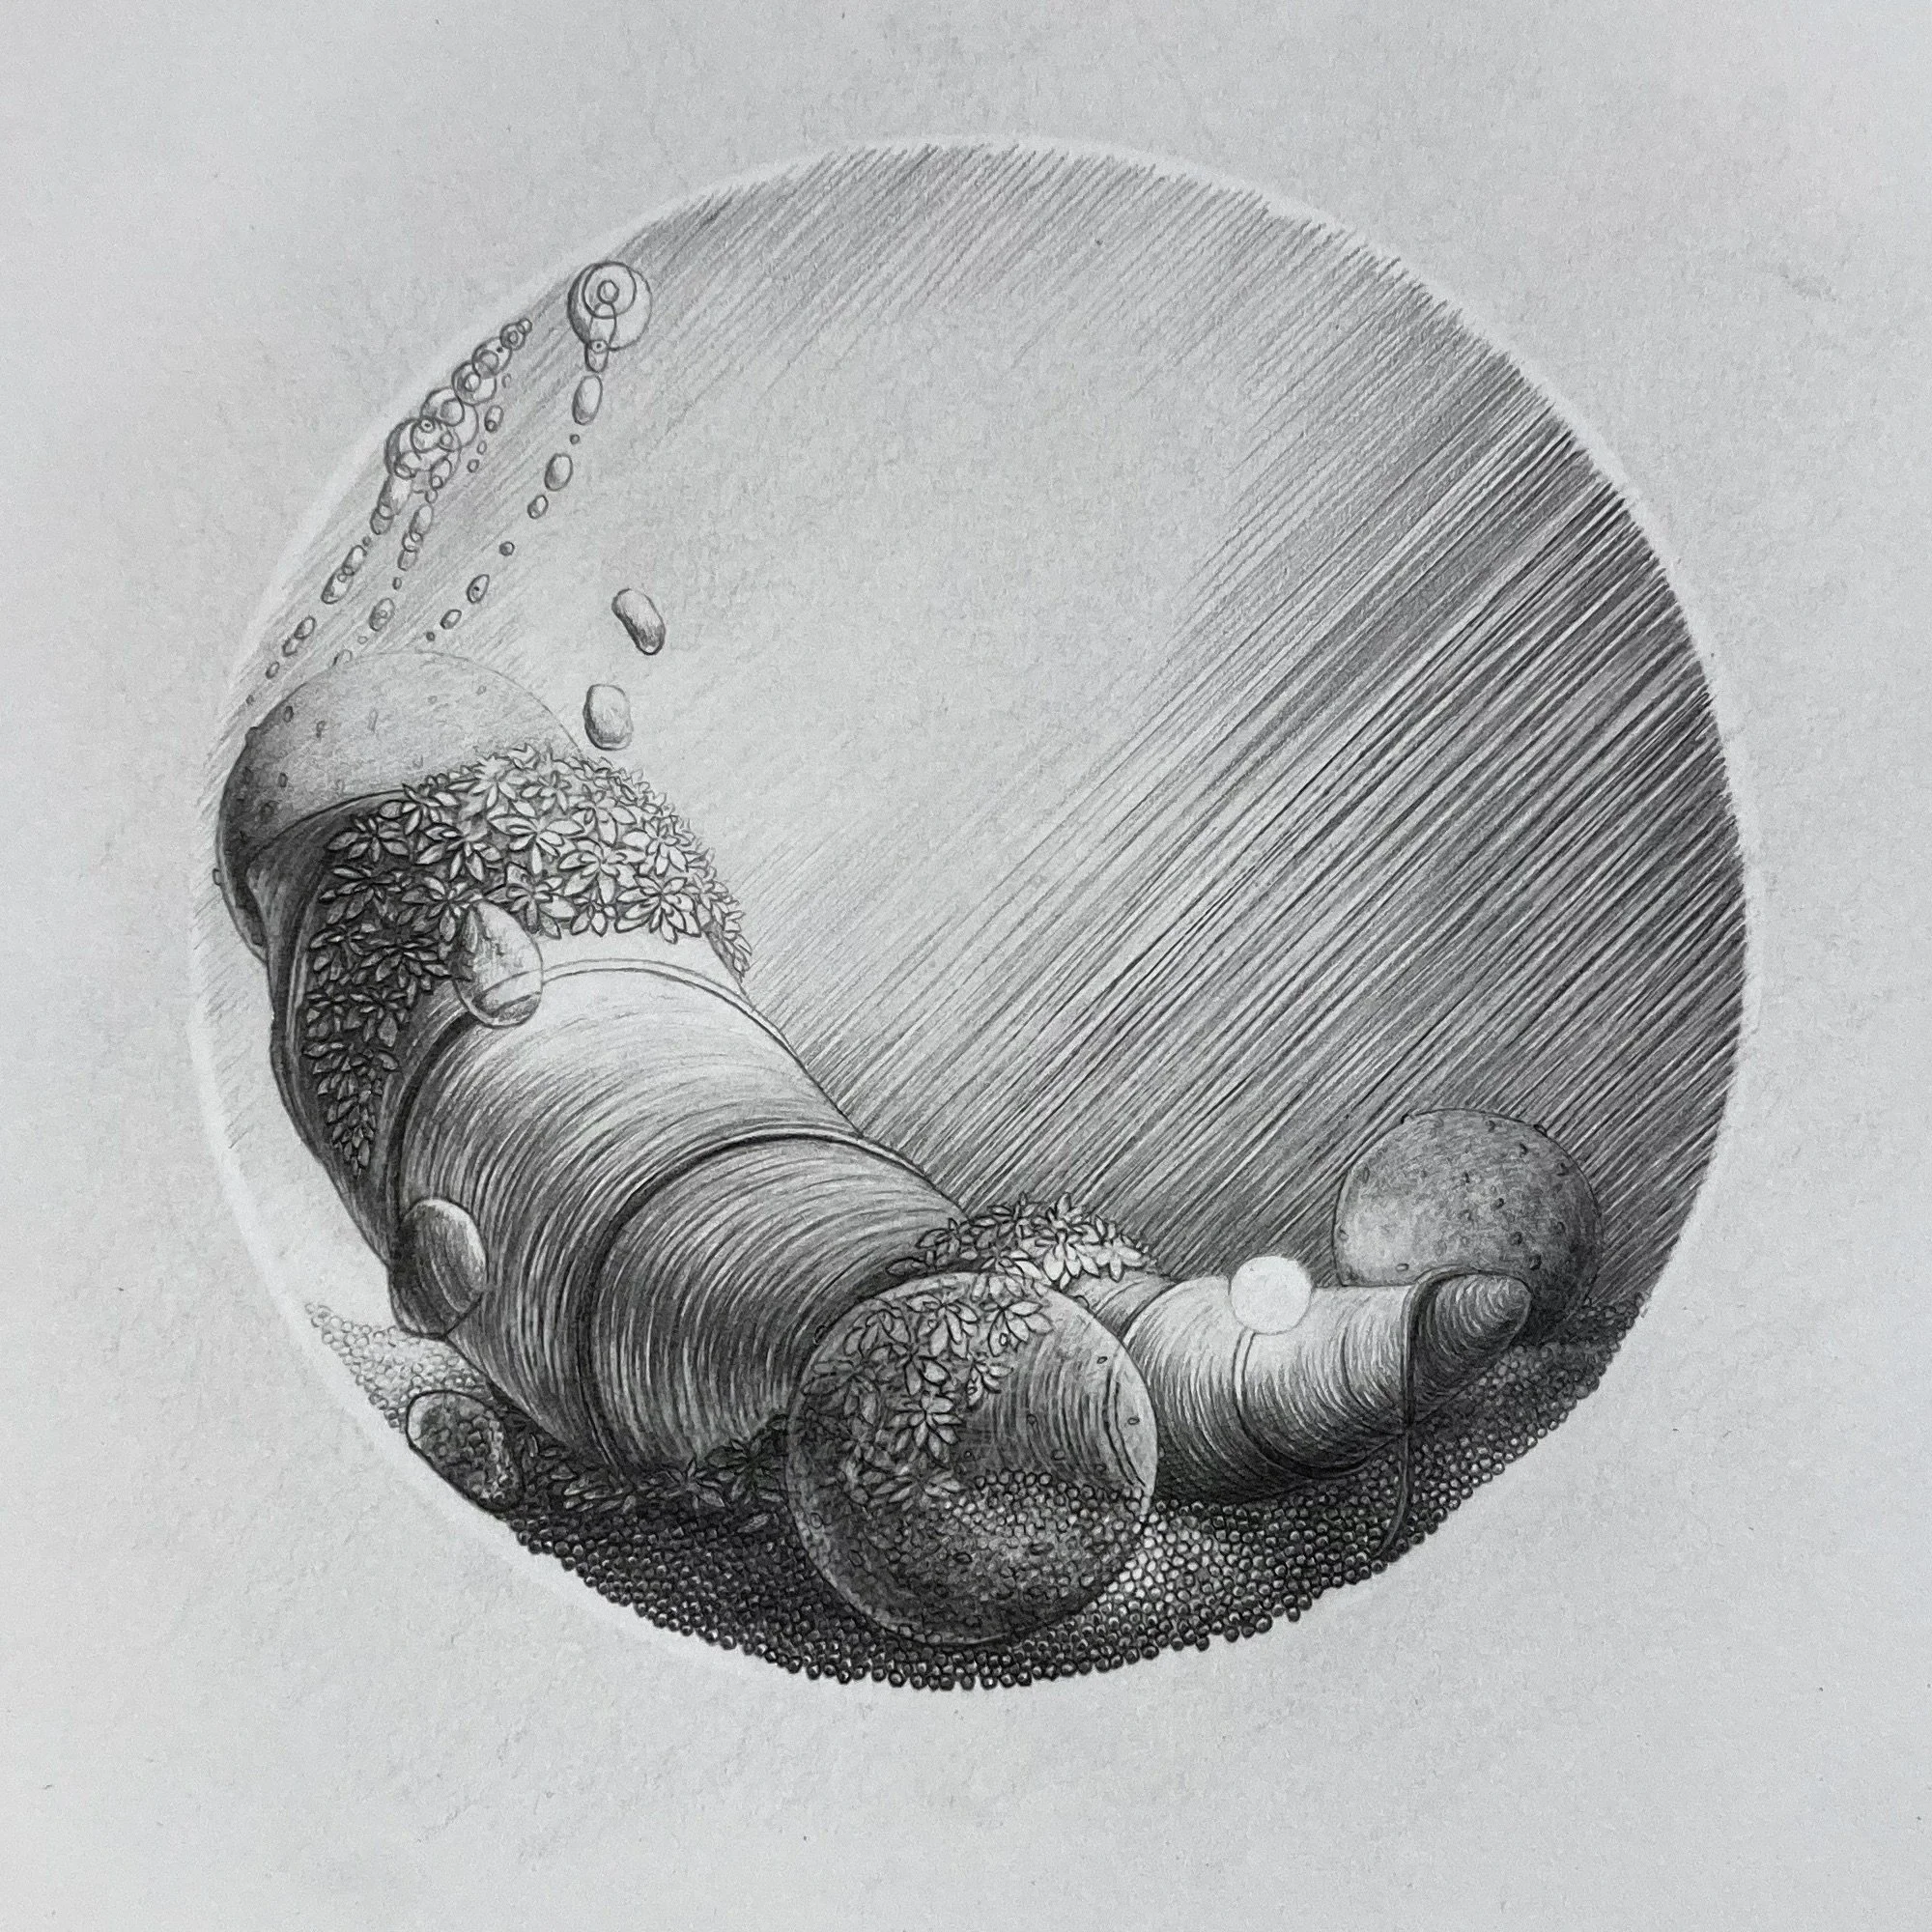
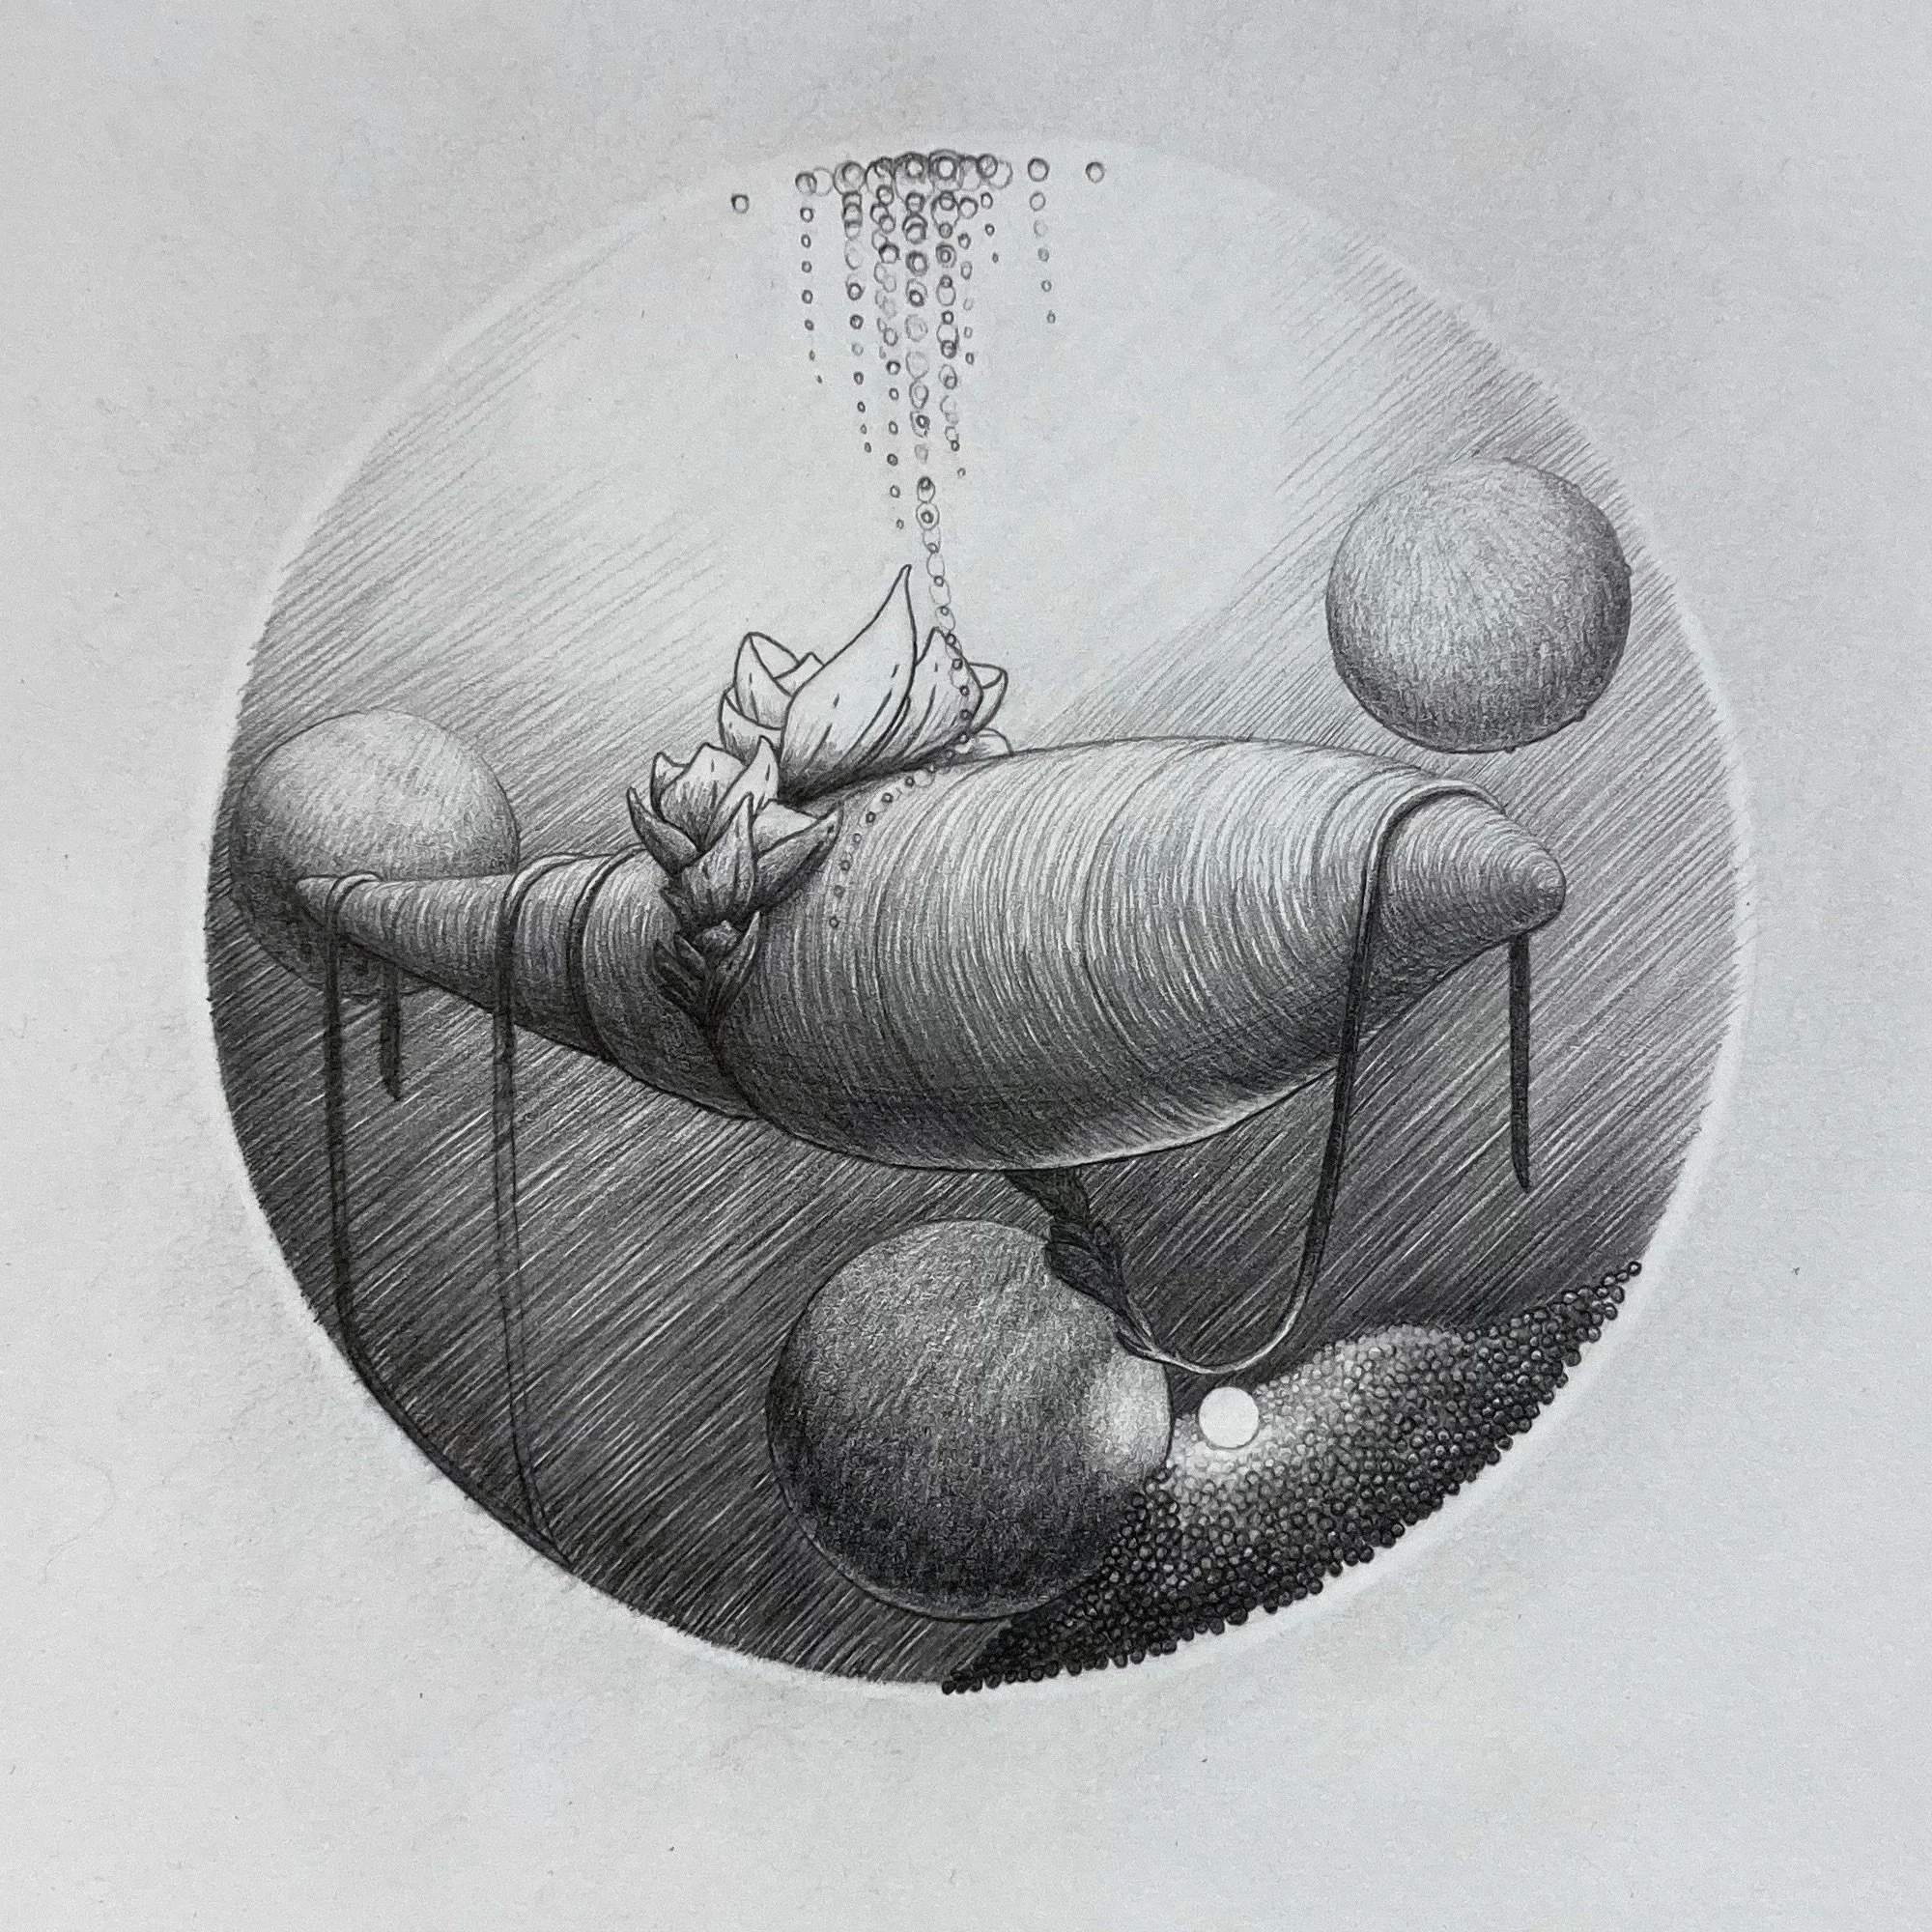
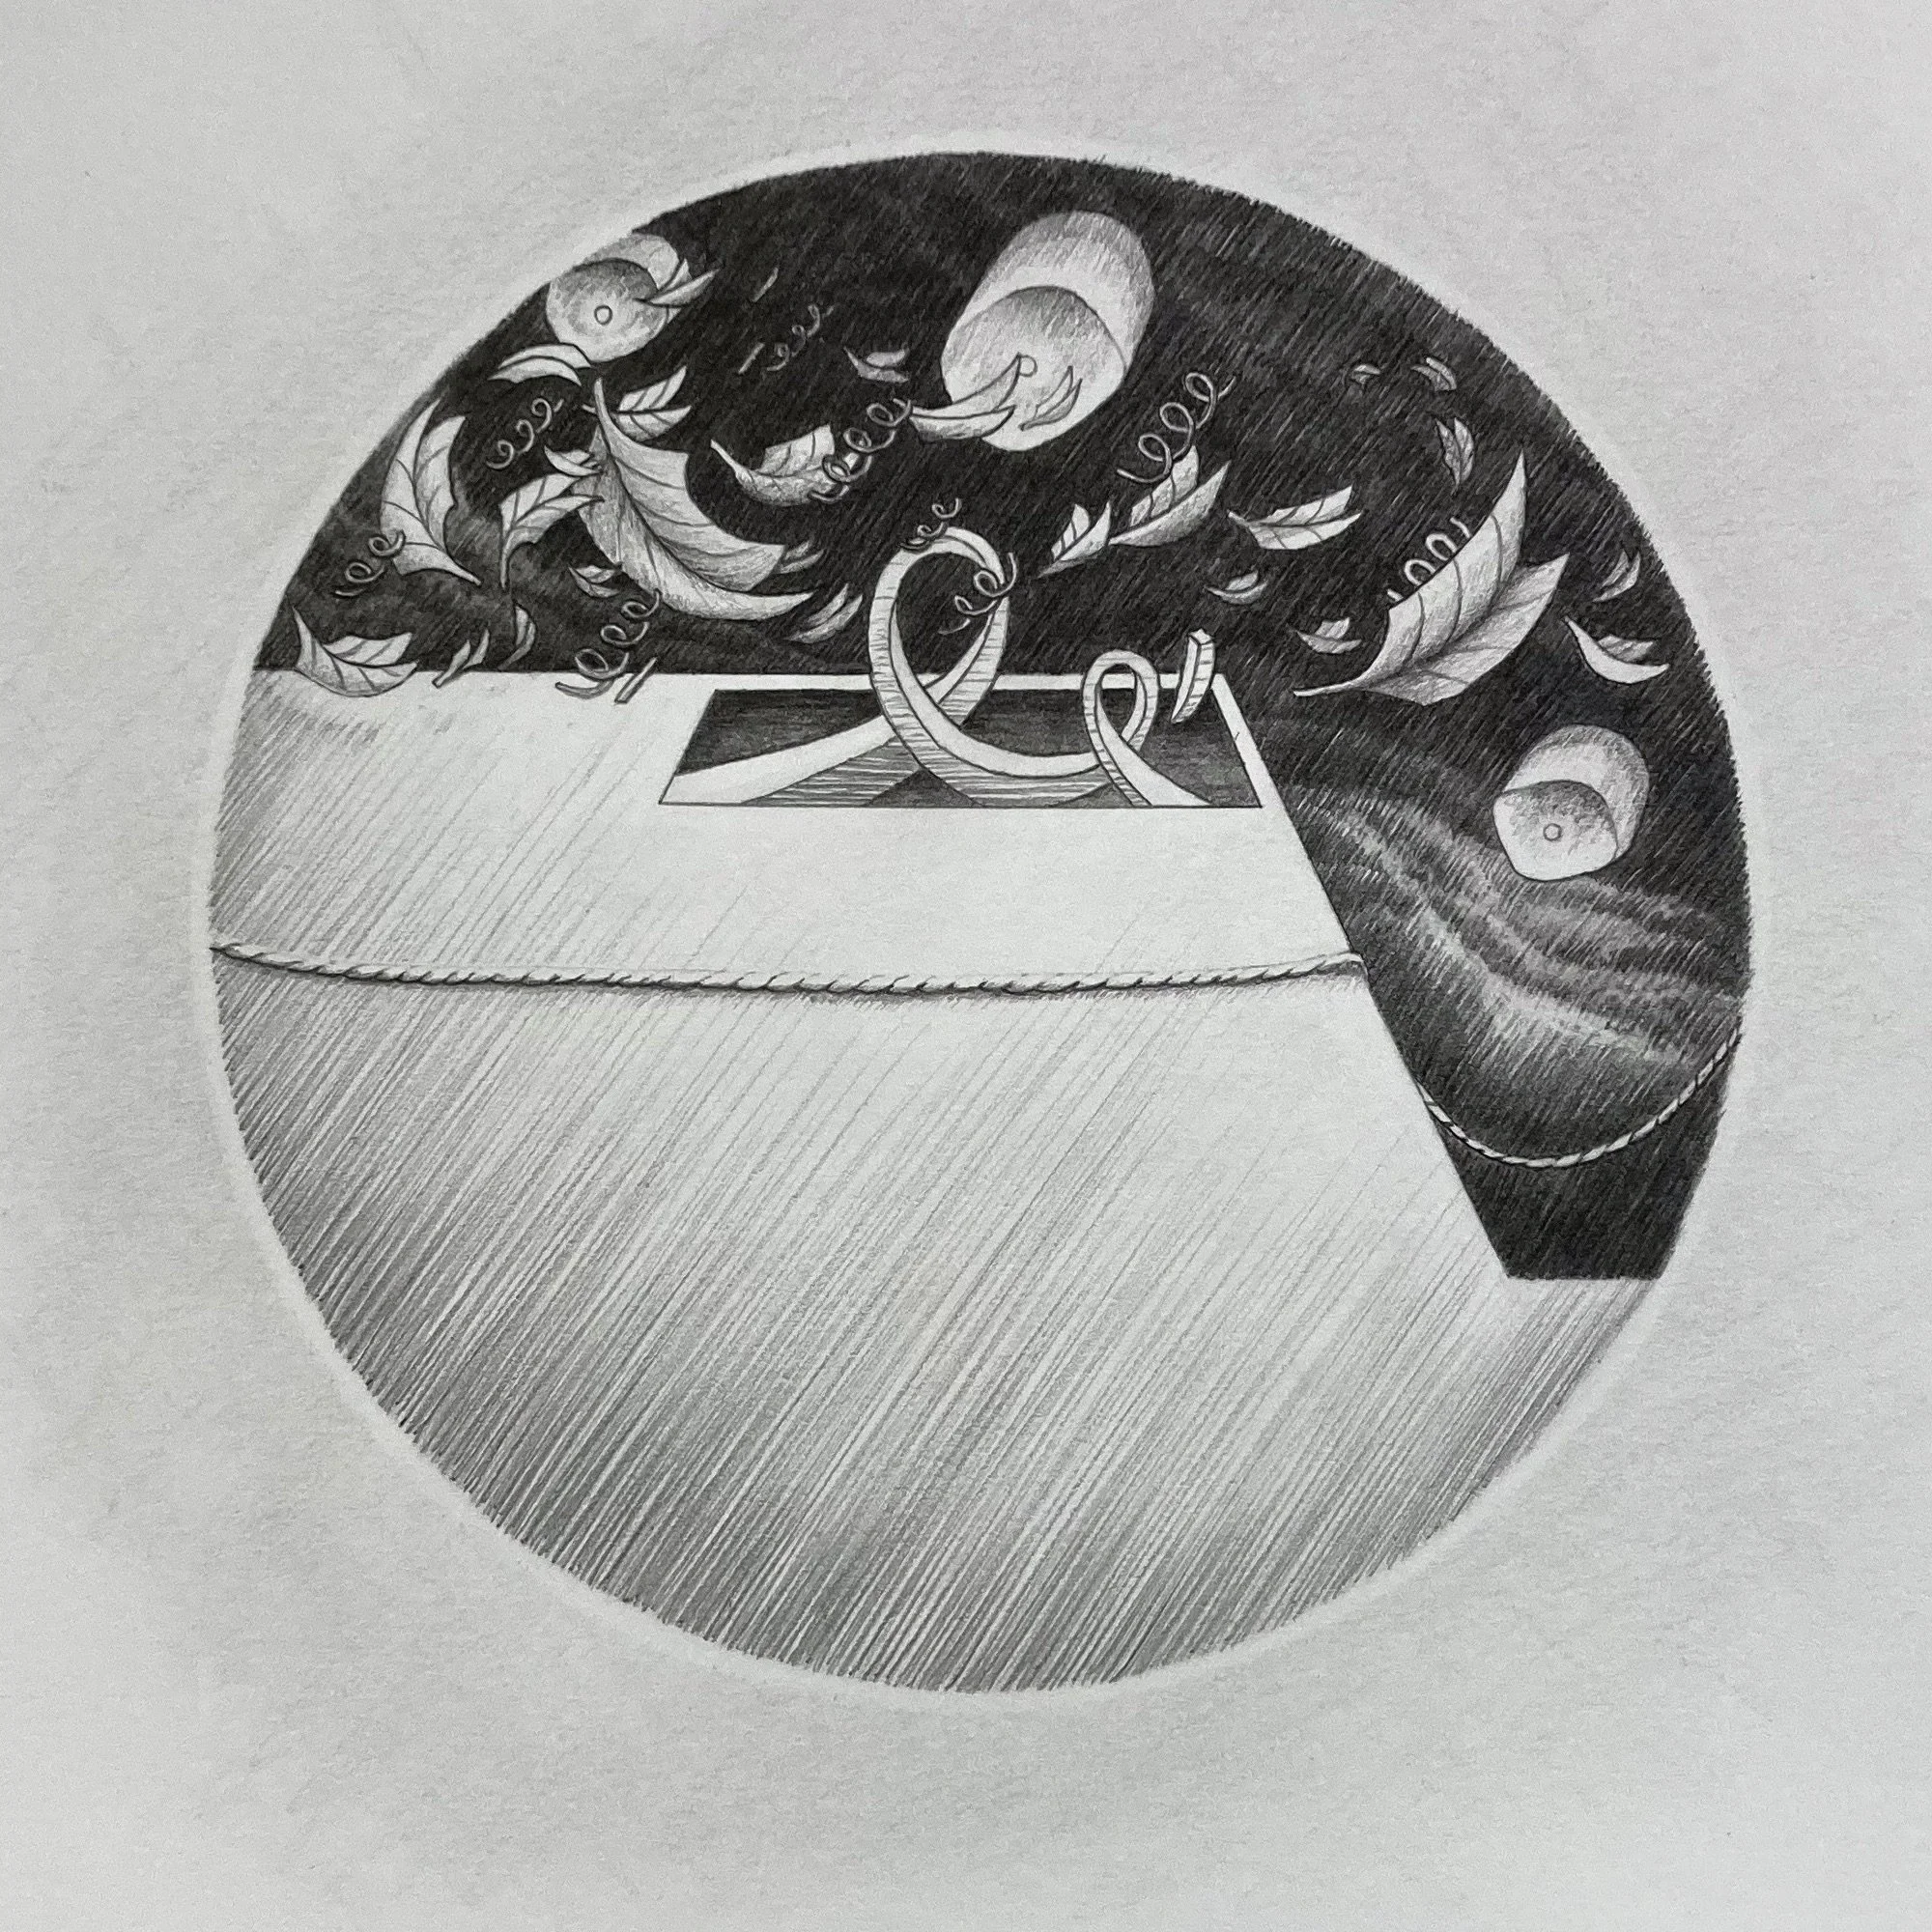
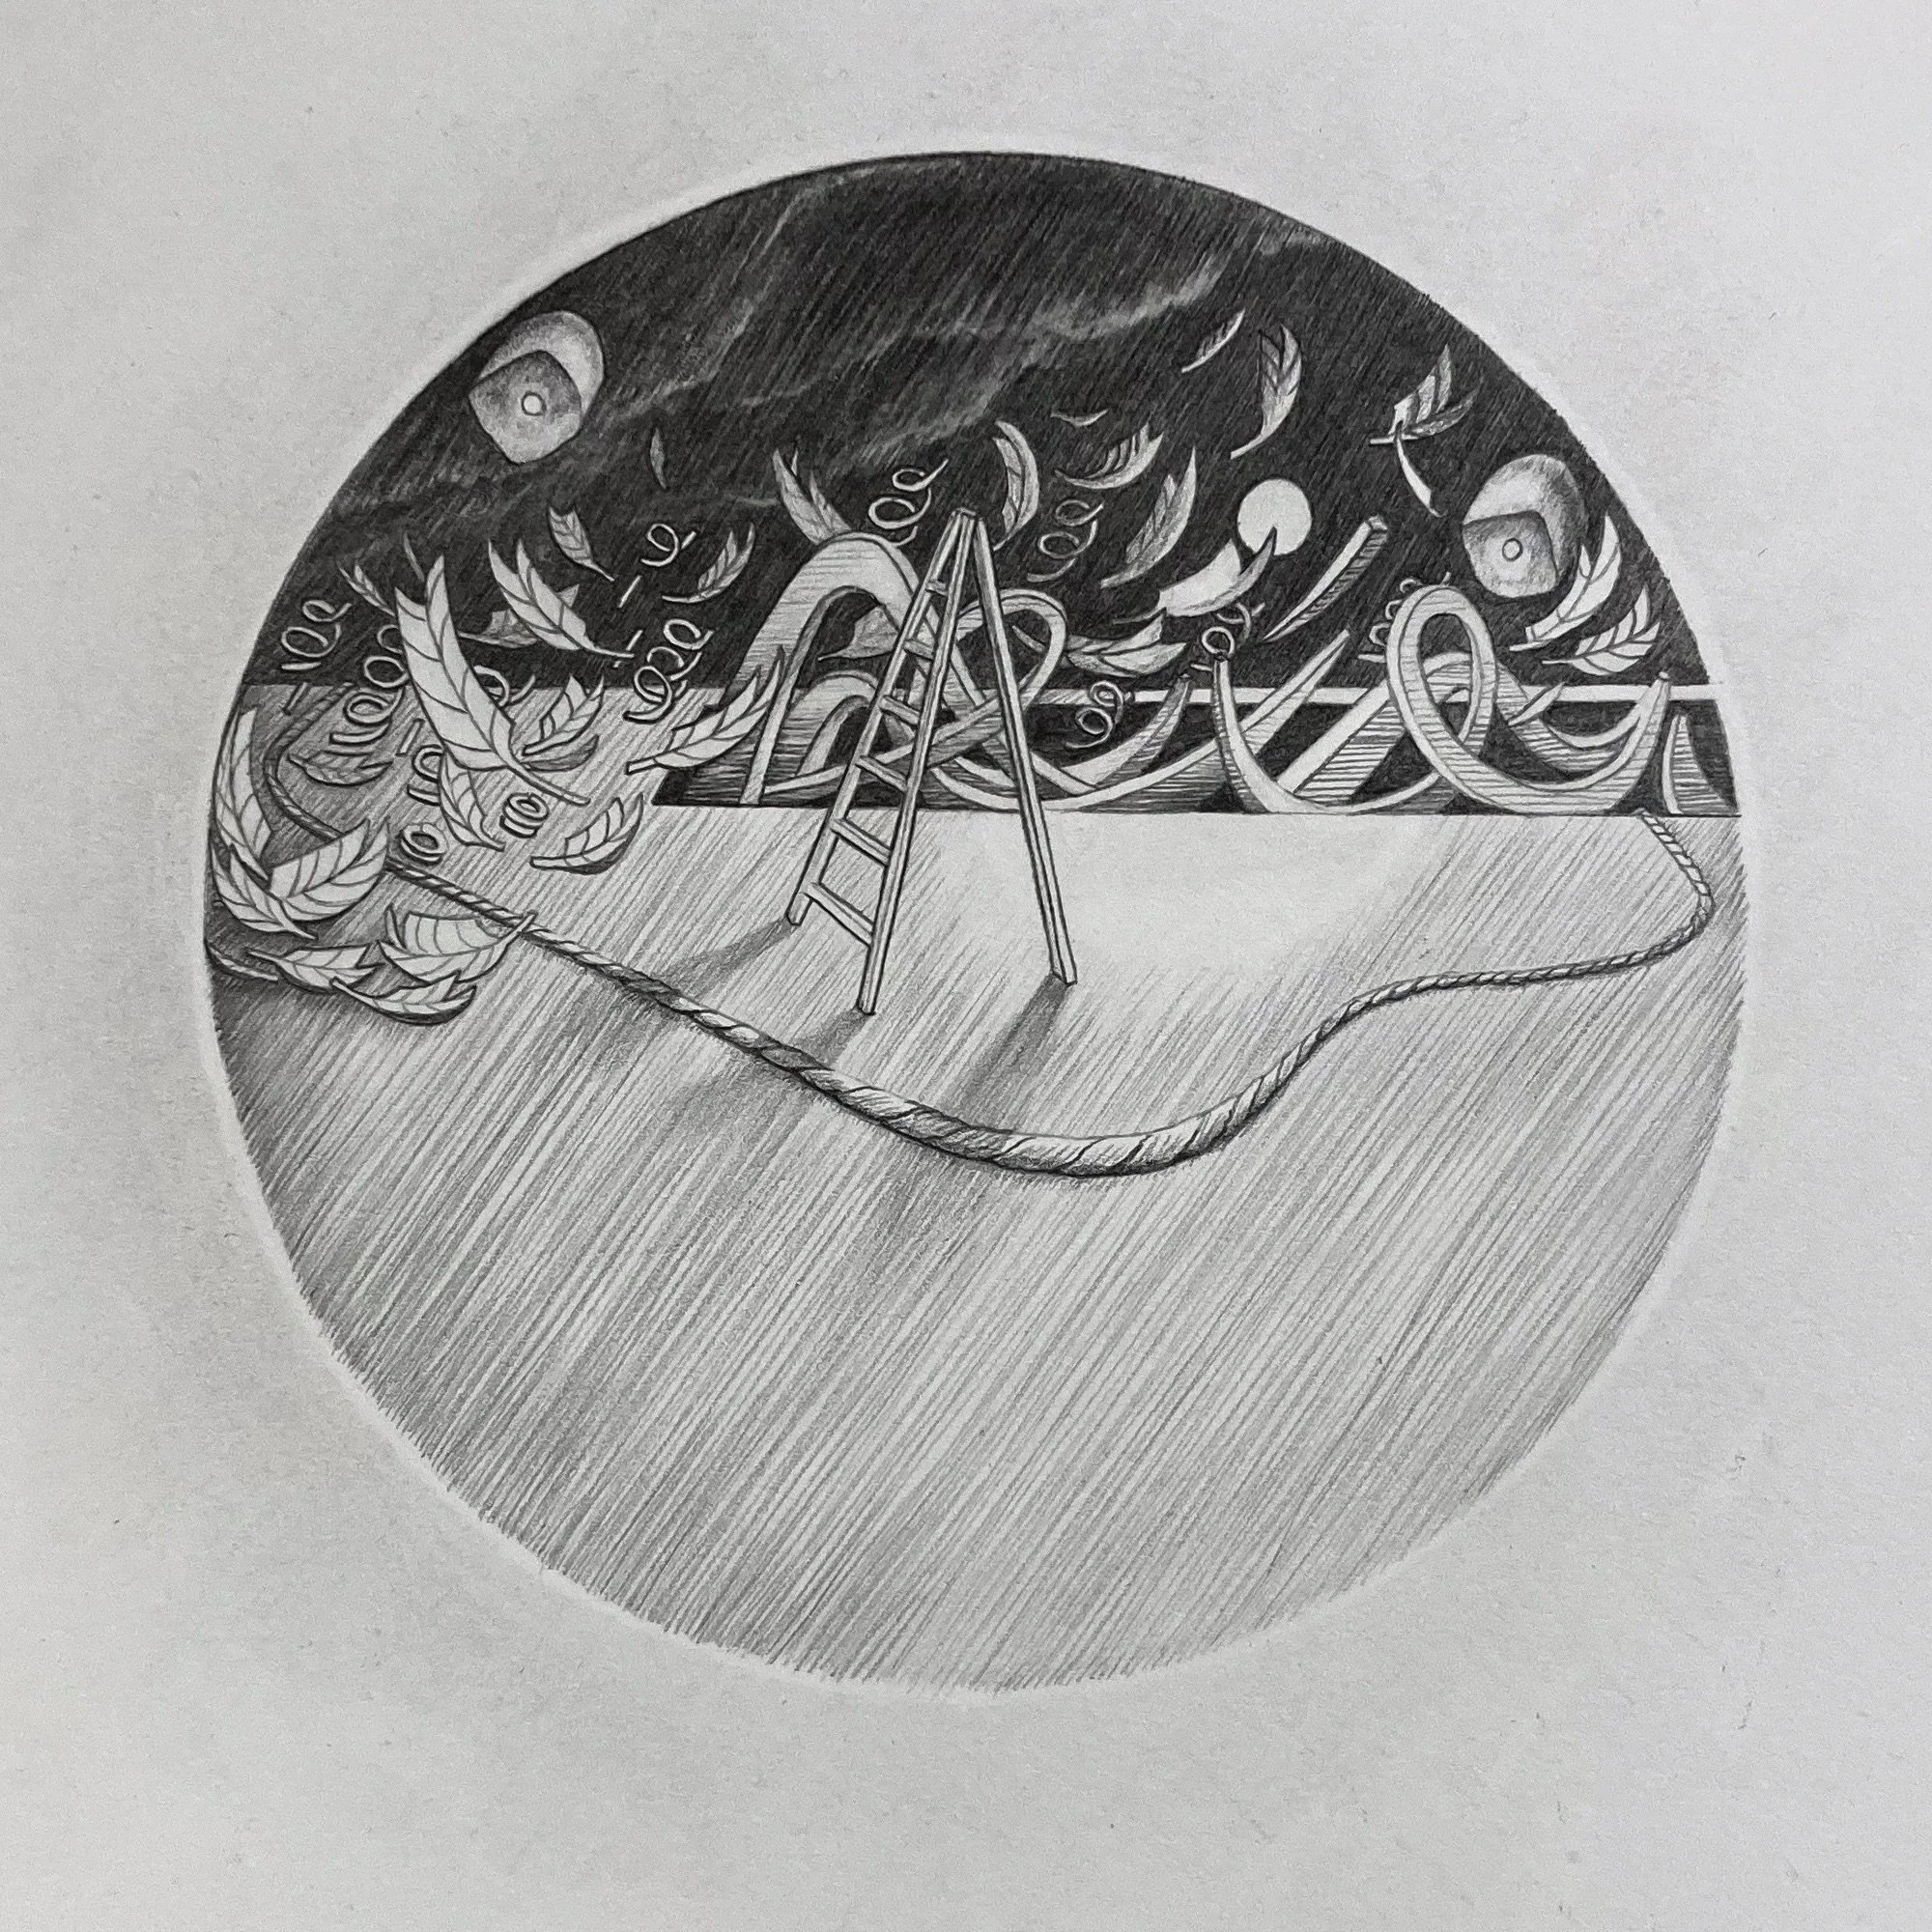
After gathering our data, I needed to determine how our information would be represented. For my days, the process was an excavation. Sketching with my pencil felt like digging into myself with my hands. I unearthed intestinal forms to describe my energy levels and piles of tiny black pearls to illustrate times of despair. I drew lush garlands, adorning and constricting, visualizing the feeling of being in service to others.
Discovering Tom’s language was a different process entirely. I felt confident in creating a visual language that I could inhabit, but could I do the same for someone else?
I designed Tom’s data-world to reflect his own unique experience of the real world. We discussed the information he’d gathered, and I asked him what it all means to him. My role here was to listen. I was asking questions and looking for associations. He’s a good storyteller, which made the process easier.
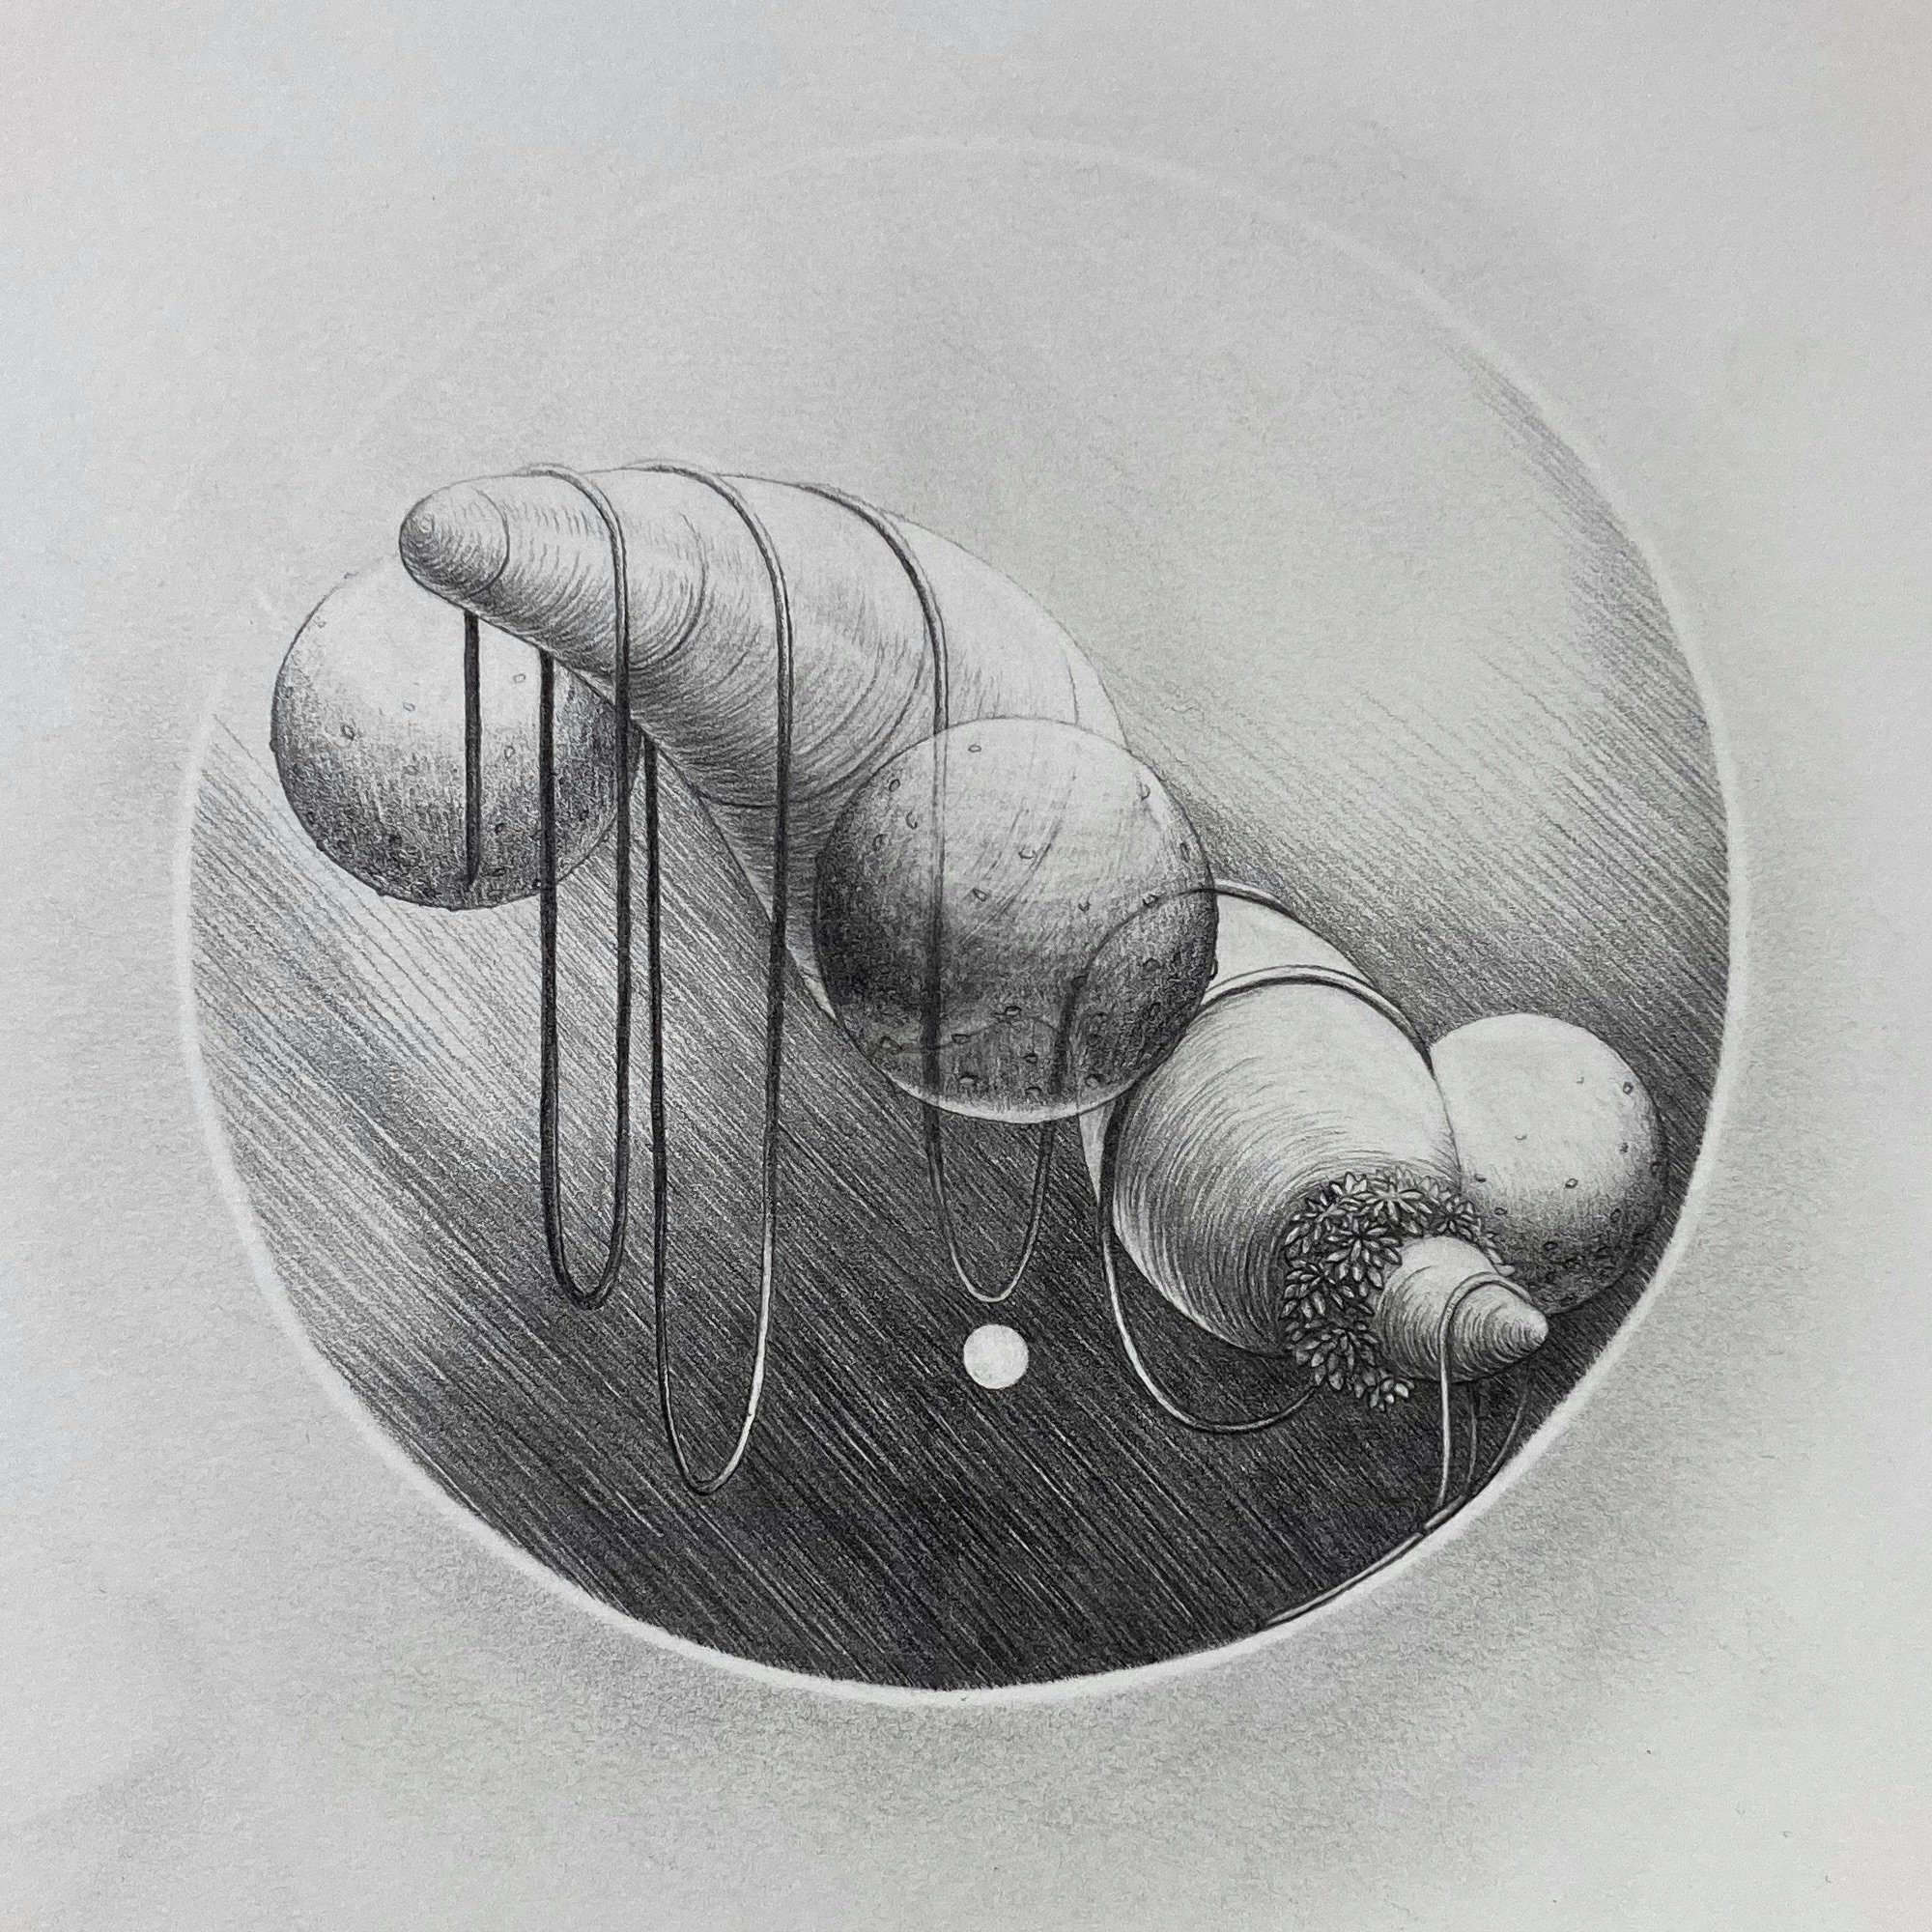
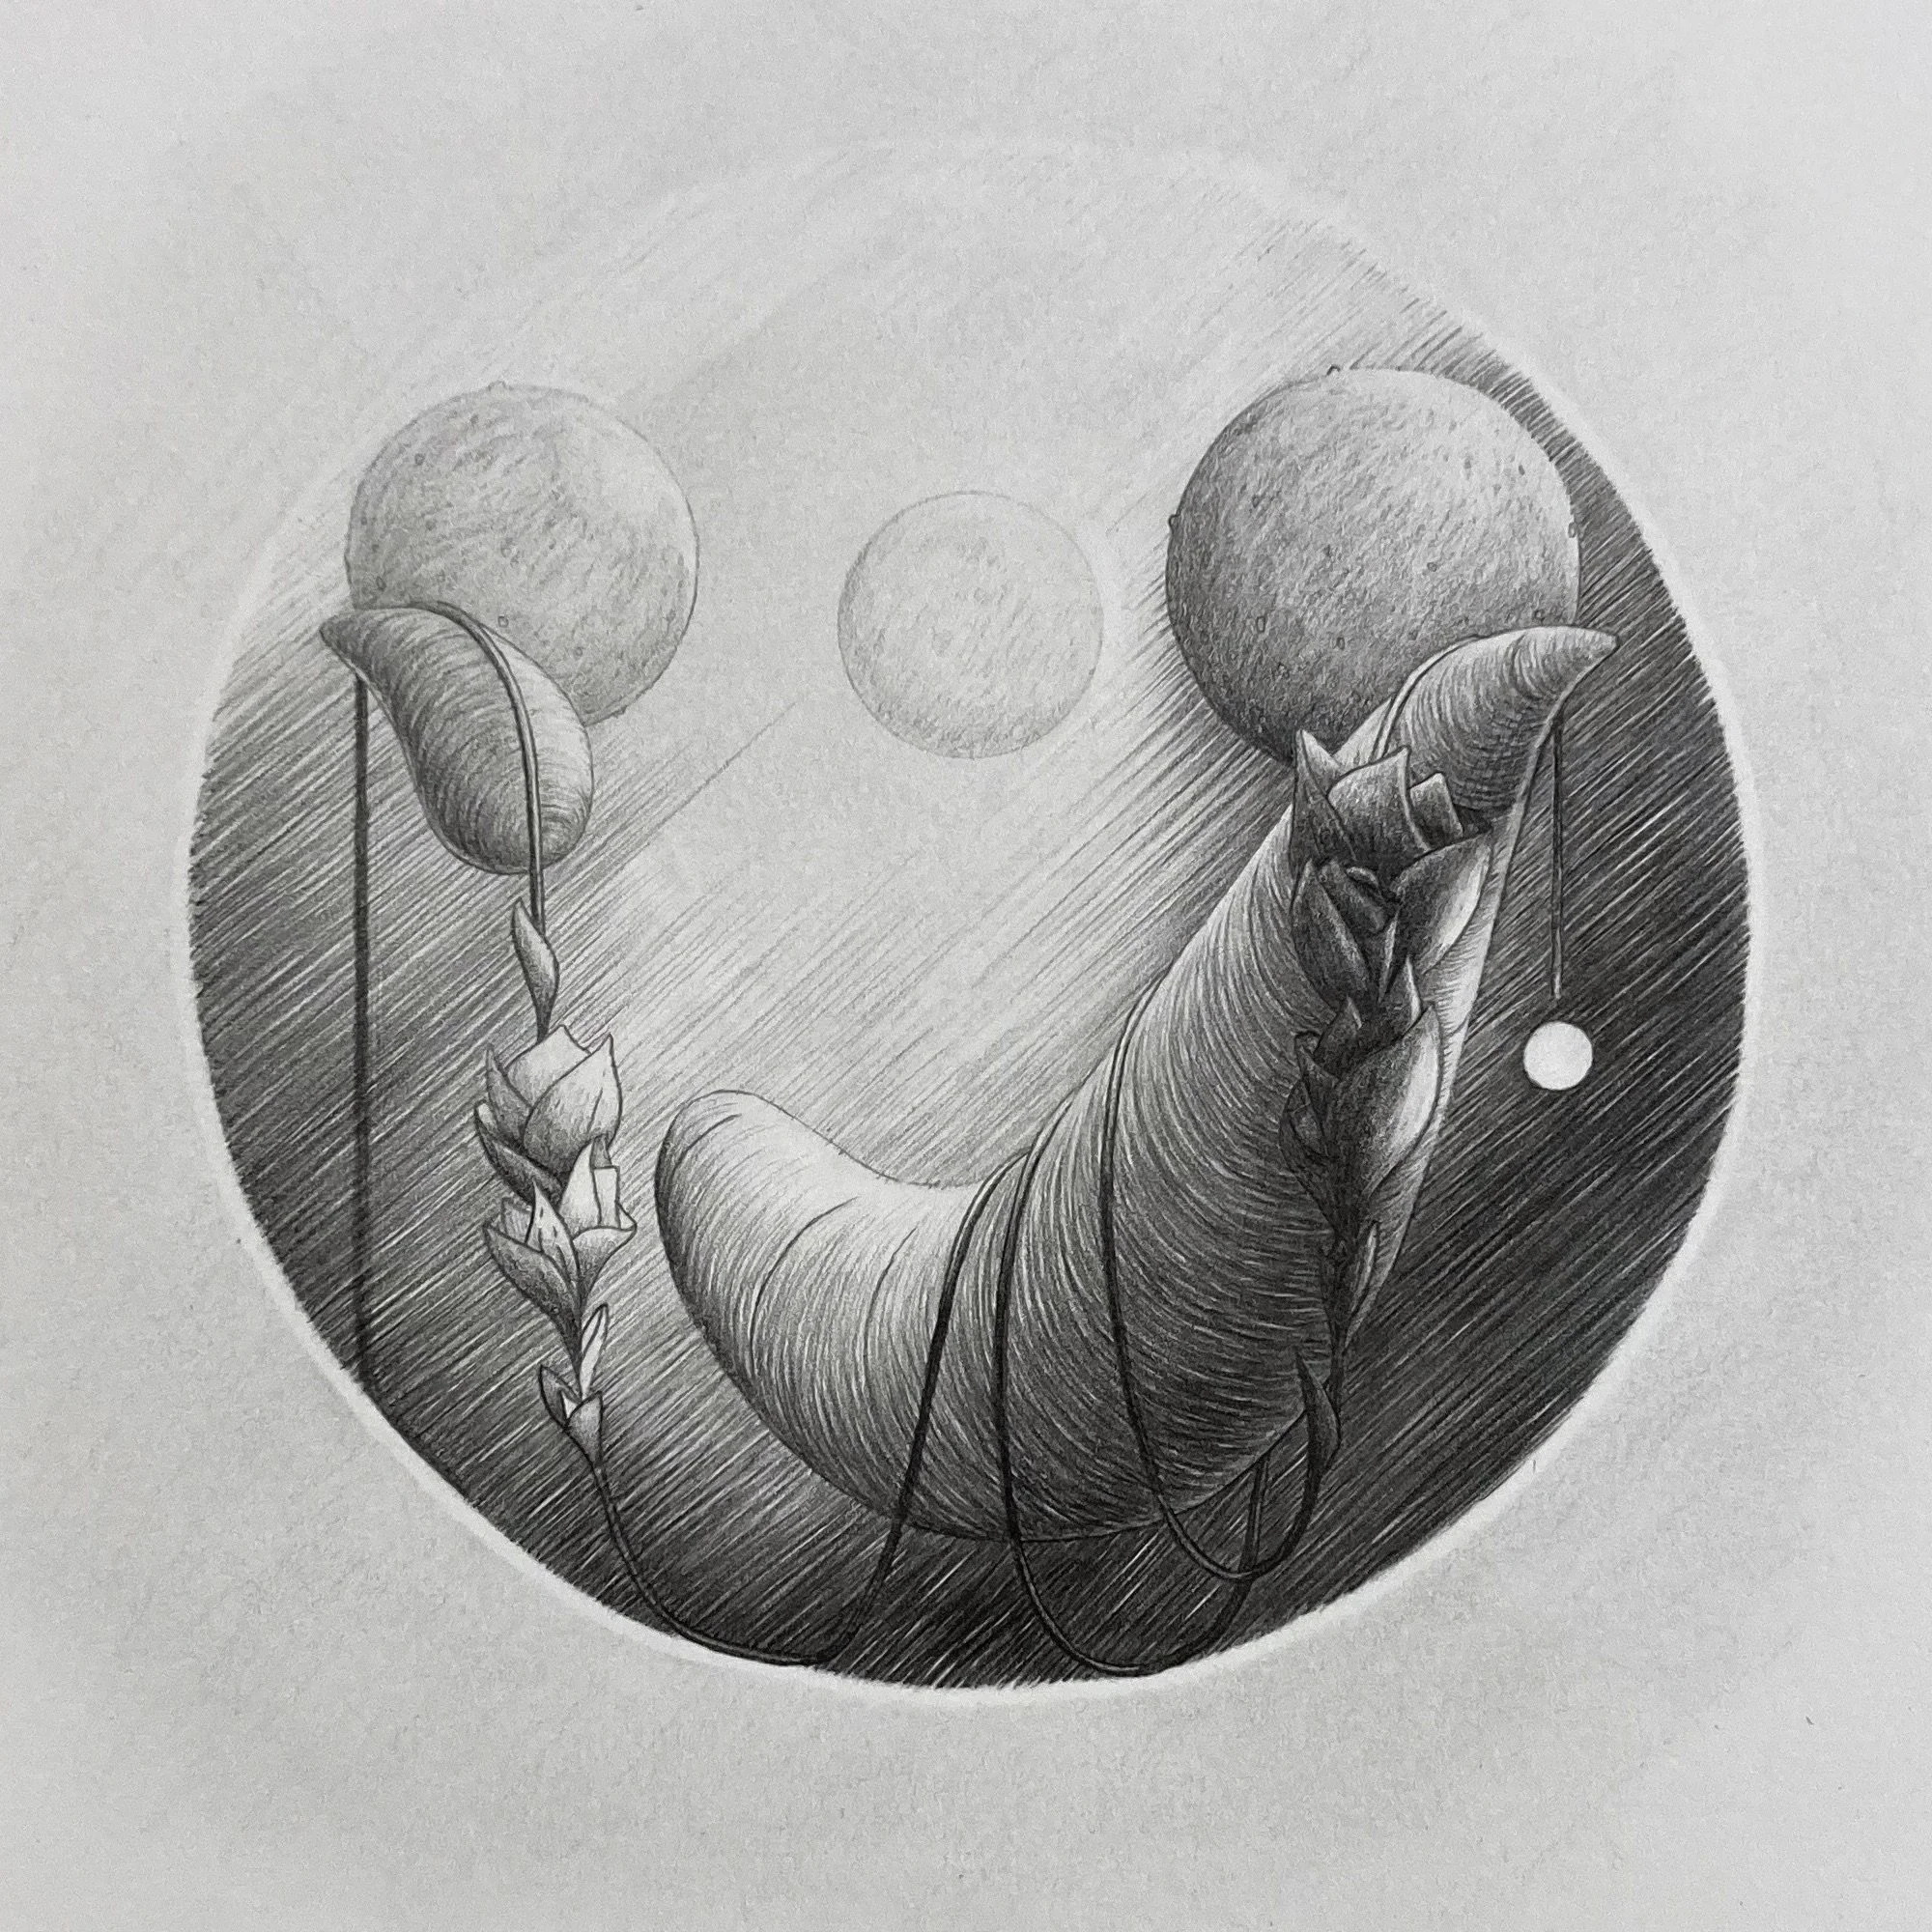
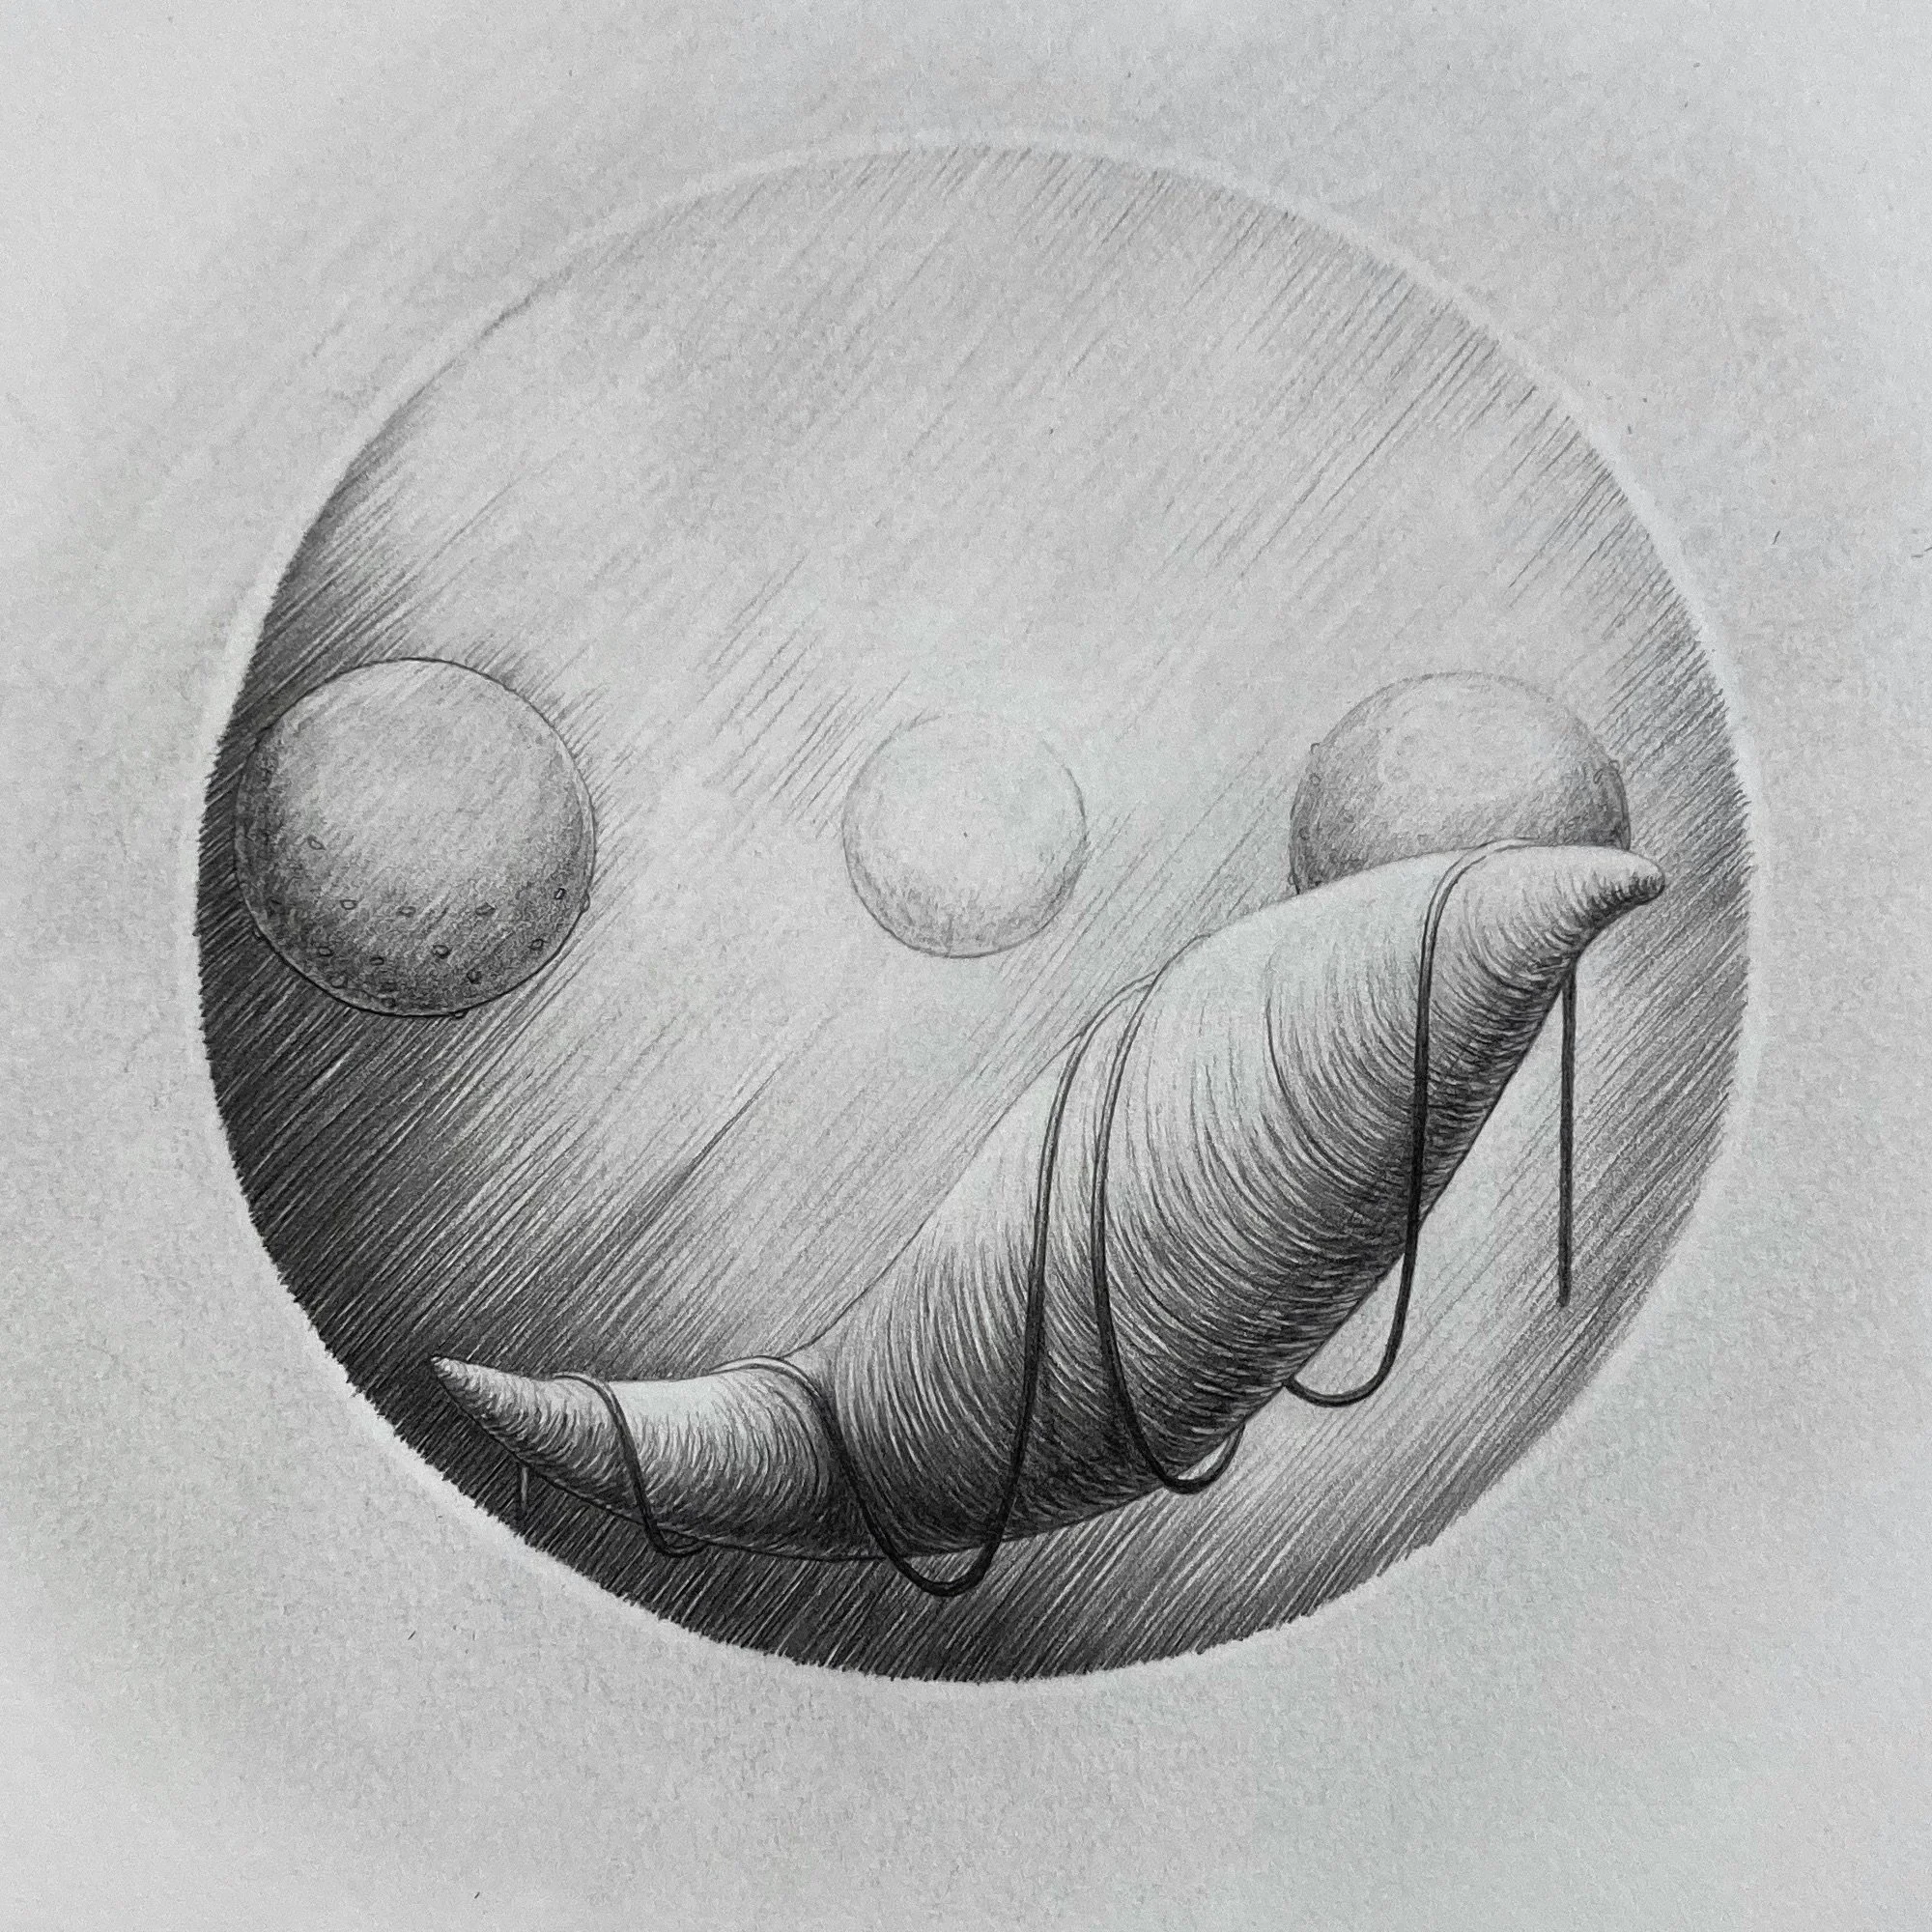
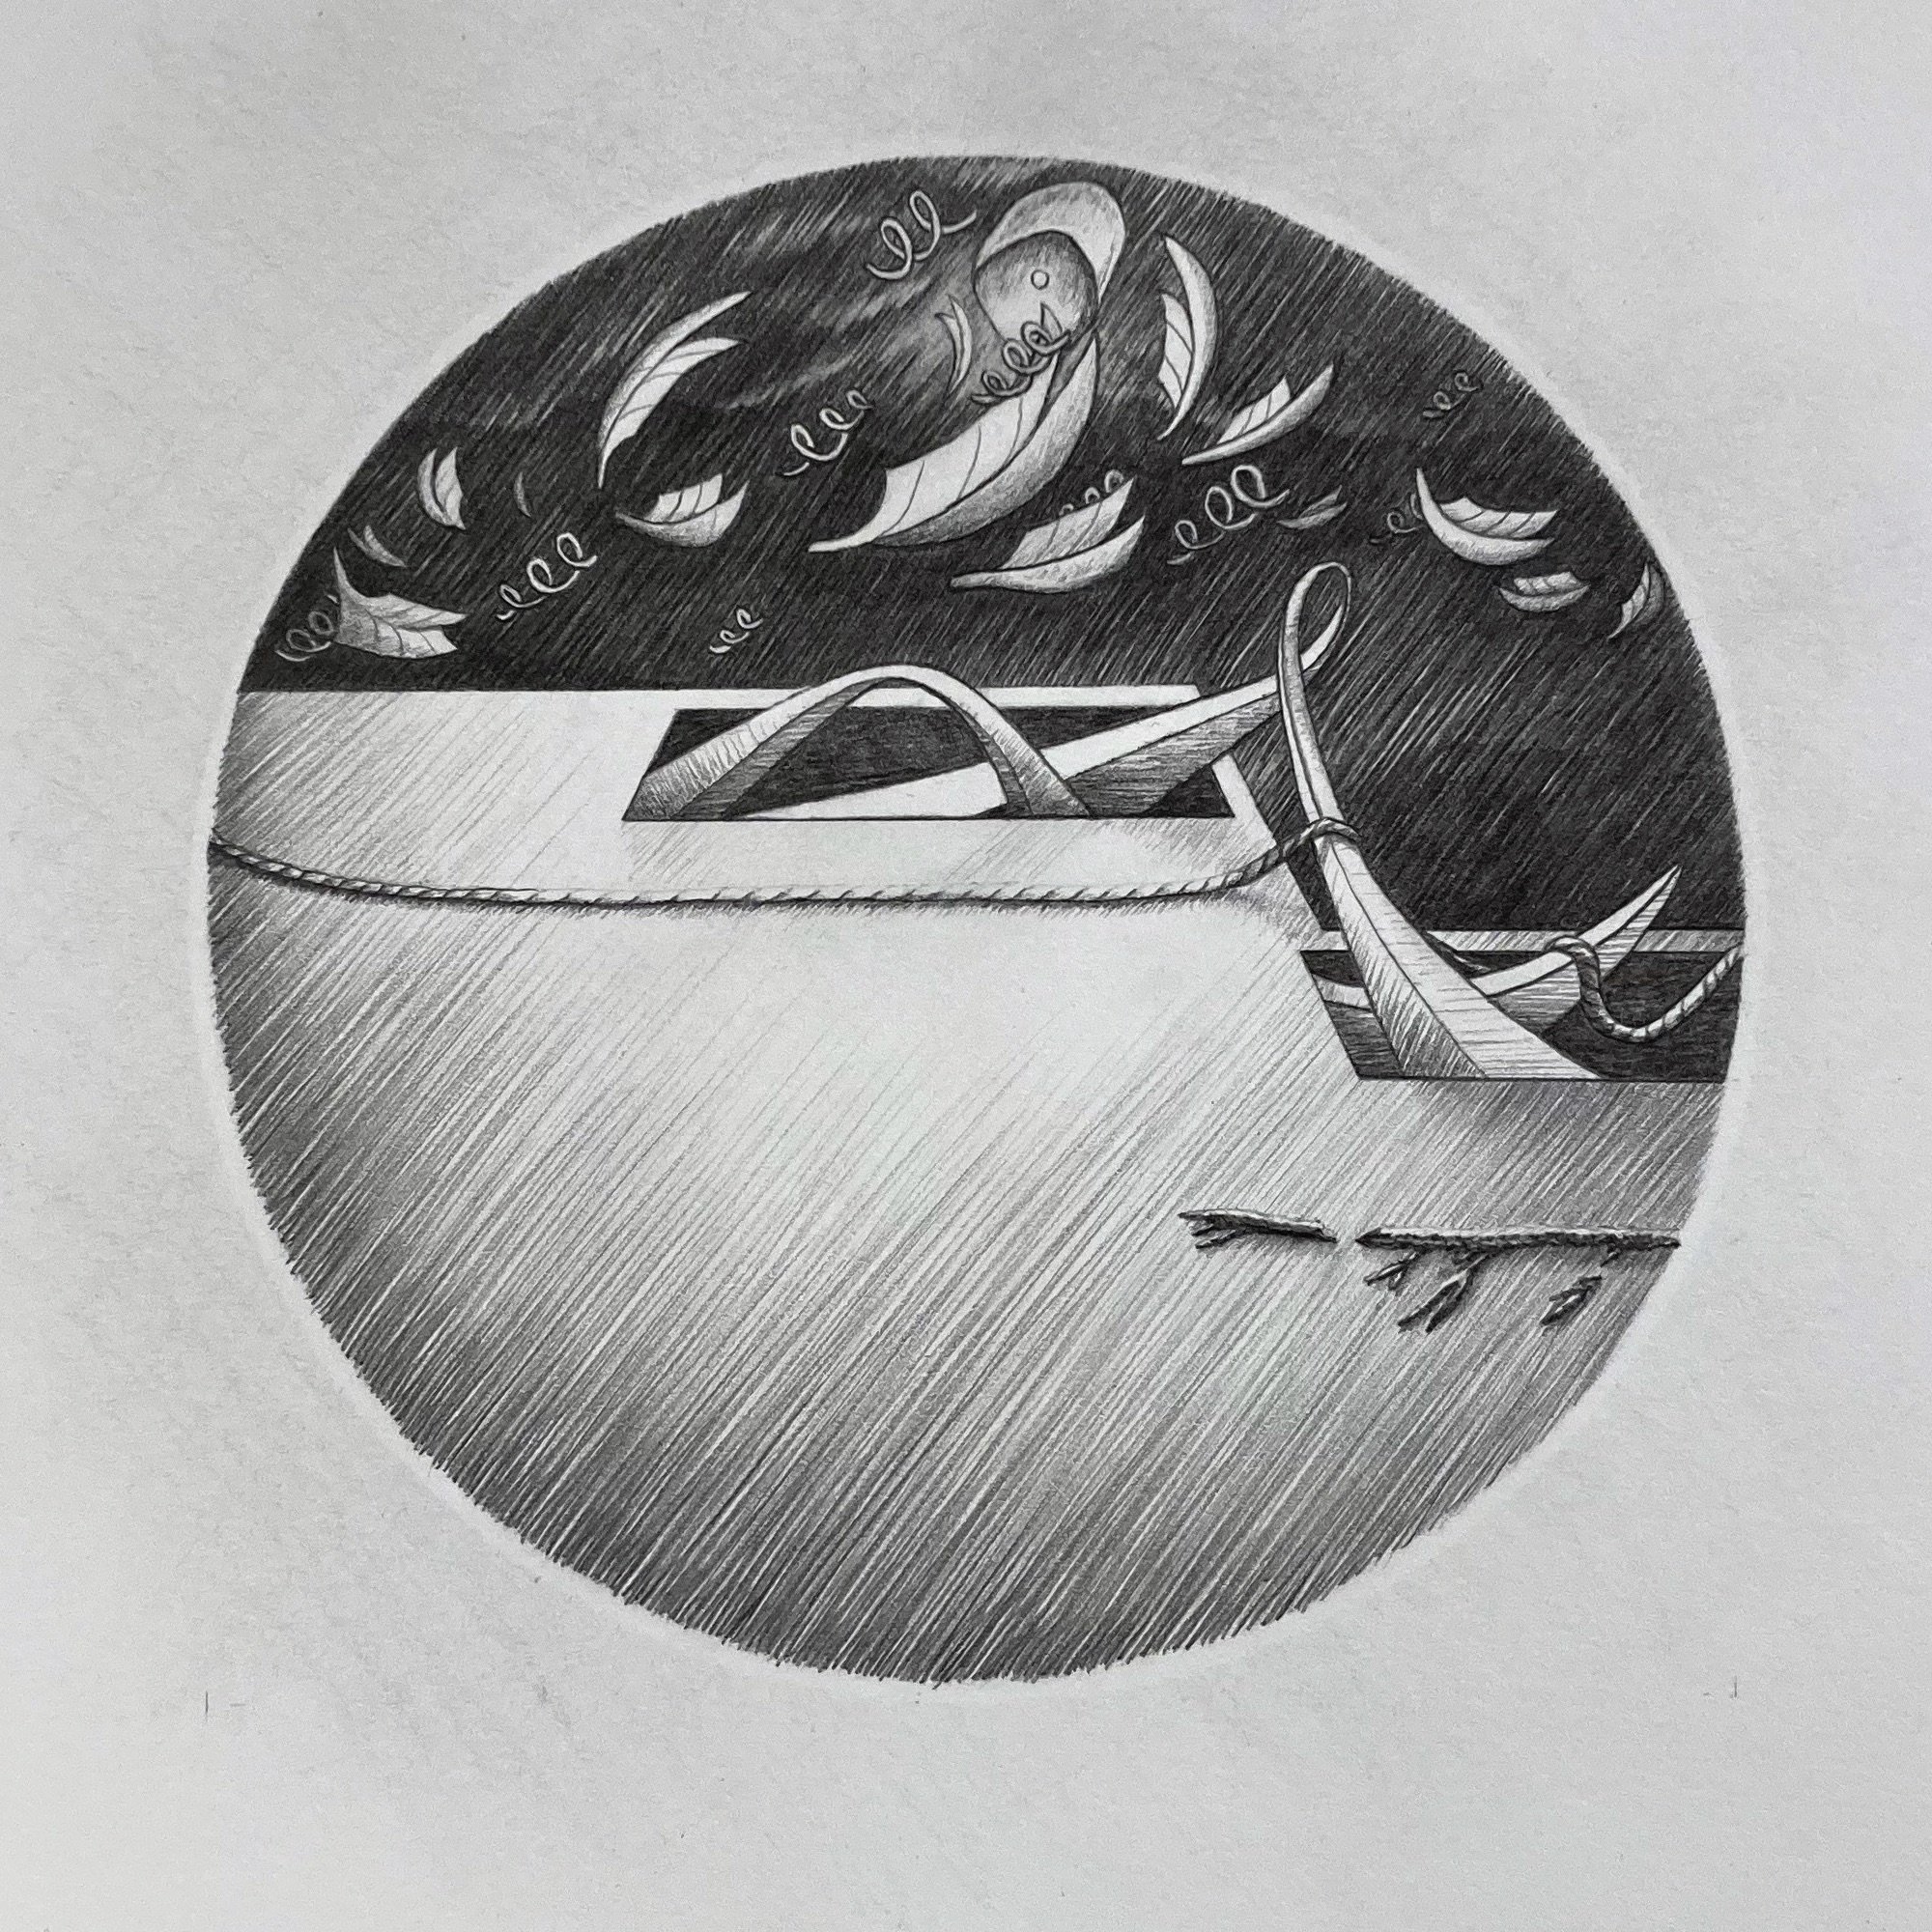
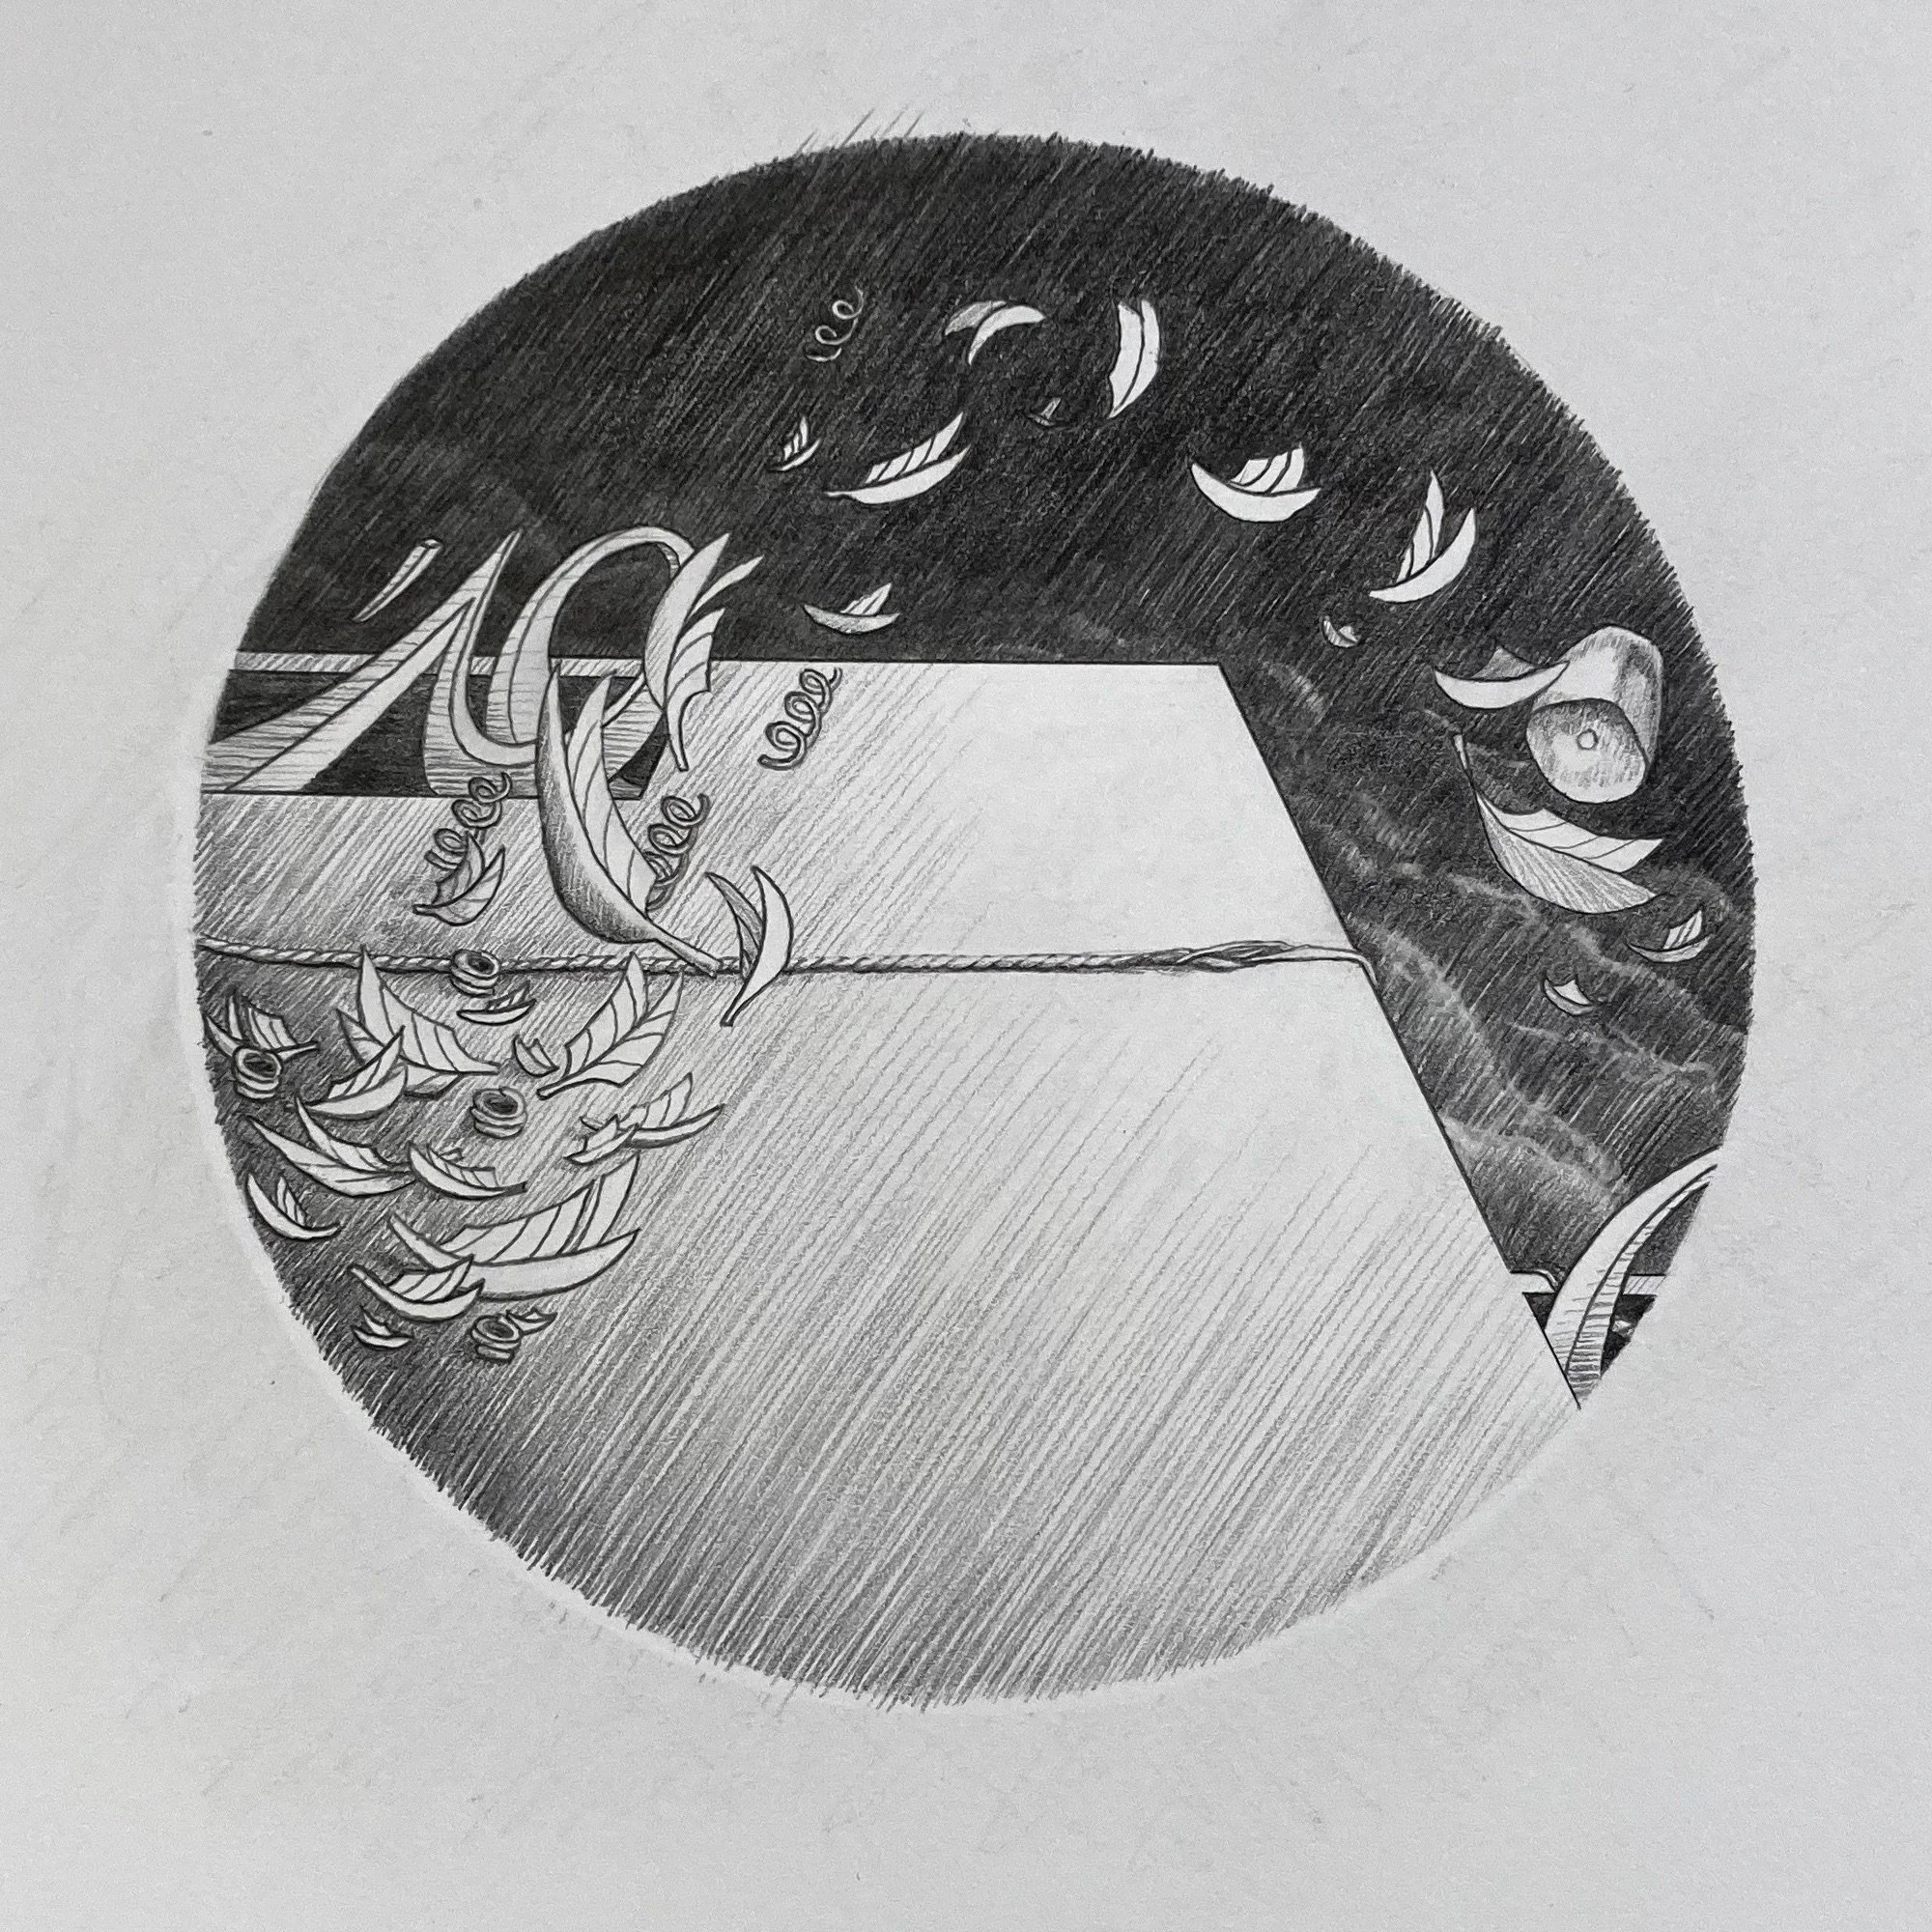
He associates being in a good mood with a springing sensation, like an old mattress whose contents have been freed from their container. When he’s energetic he feels clear, like a room he once lived in that he kept free of clutter. Clean and bare as a stage, the space holds potential for anything to happen. When he seeks nature, he heads for the forest.
The information he offered in our interview seeded his data representations. As I drew his days, I came to realize that he was painting his own picture. With the data driving the drawings, I became an observer.
Sarah, week of Oct 15, 2019 | graphite on paper, 8x8”
Tom, week of Oct 15, 2019 | graphite on paper, 8x8”
Interpreting the drawings.
Imagine each drawing as a window into an intimate biome of self, contained within a circle. The same forms repeat, but in different arrangements based on the data. The day’s story develops in the interactions between these forms. Strung together in the sequence of a week, larger patterns emerge.
The drawings can be appreciated on their own but gain context and meaning when they’re analyzed using the key. We’re used to seeing information presented visually in bar graphs and pie charts. I’m offering a different system, based on the same principles but with visual outcomes that are unique to each person.
Observing the drawings, one can see a narrative unfolding over the course of the week. For deeper analysis, they can be read alongside the data key. For participants, the drawings can be used as a tool for connection and communication: one can look at their days and reflect on them as internal landscapes. They can be shared, building connection in places that words might fail to reach.
Each drawing is read left to right, with elements placed chronologically according to the values recorded in the data. The key to reading the drawings is below.
Sarah’s Data Key
Tom’s Data Key

Project 2 / April, 2020
Mid-way through producing the finished drawings for Seven Days, the pandemic hit. Morgues in New York City, my home for many years, were overflowing. People couldn’t be with their loved ones as they died. It felt like watching my neighbourhood burning and being told to go back inside.
As lockdown set in, I wondered if my drawing system could generate some connection. Mobilizing, I gathered ten volunteers from around the world - from New York City to rural Uganda, and at home in BC - to take part in the project.
Following the same process I used for Seven Days, I collected a week of data from each participant. It felt like drawing a line, where I'm holding one end and someone else the other, so we're both less alone. As an ongoing work, I’m building a set of drawings for each participant.
My hope is that this work can help people build self-awareness. The private spaces I describe are not always beautiful… what’s beautiful is the acknowledgement and sharing of them. Meeting someone else in the muck and the honesty.
Engaging with people through my materials becomes a way of expressing care for them.
Ruby / Brooklyn NY
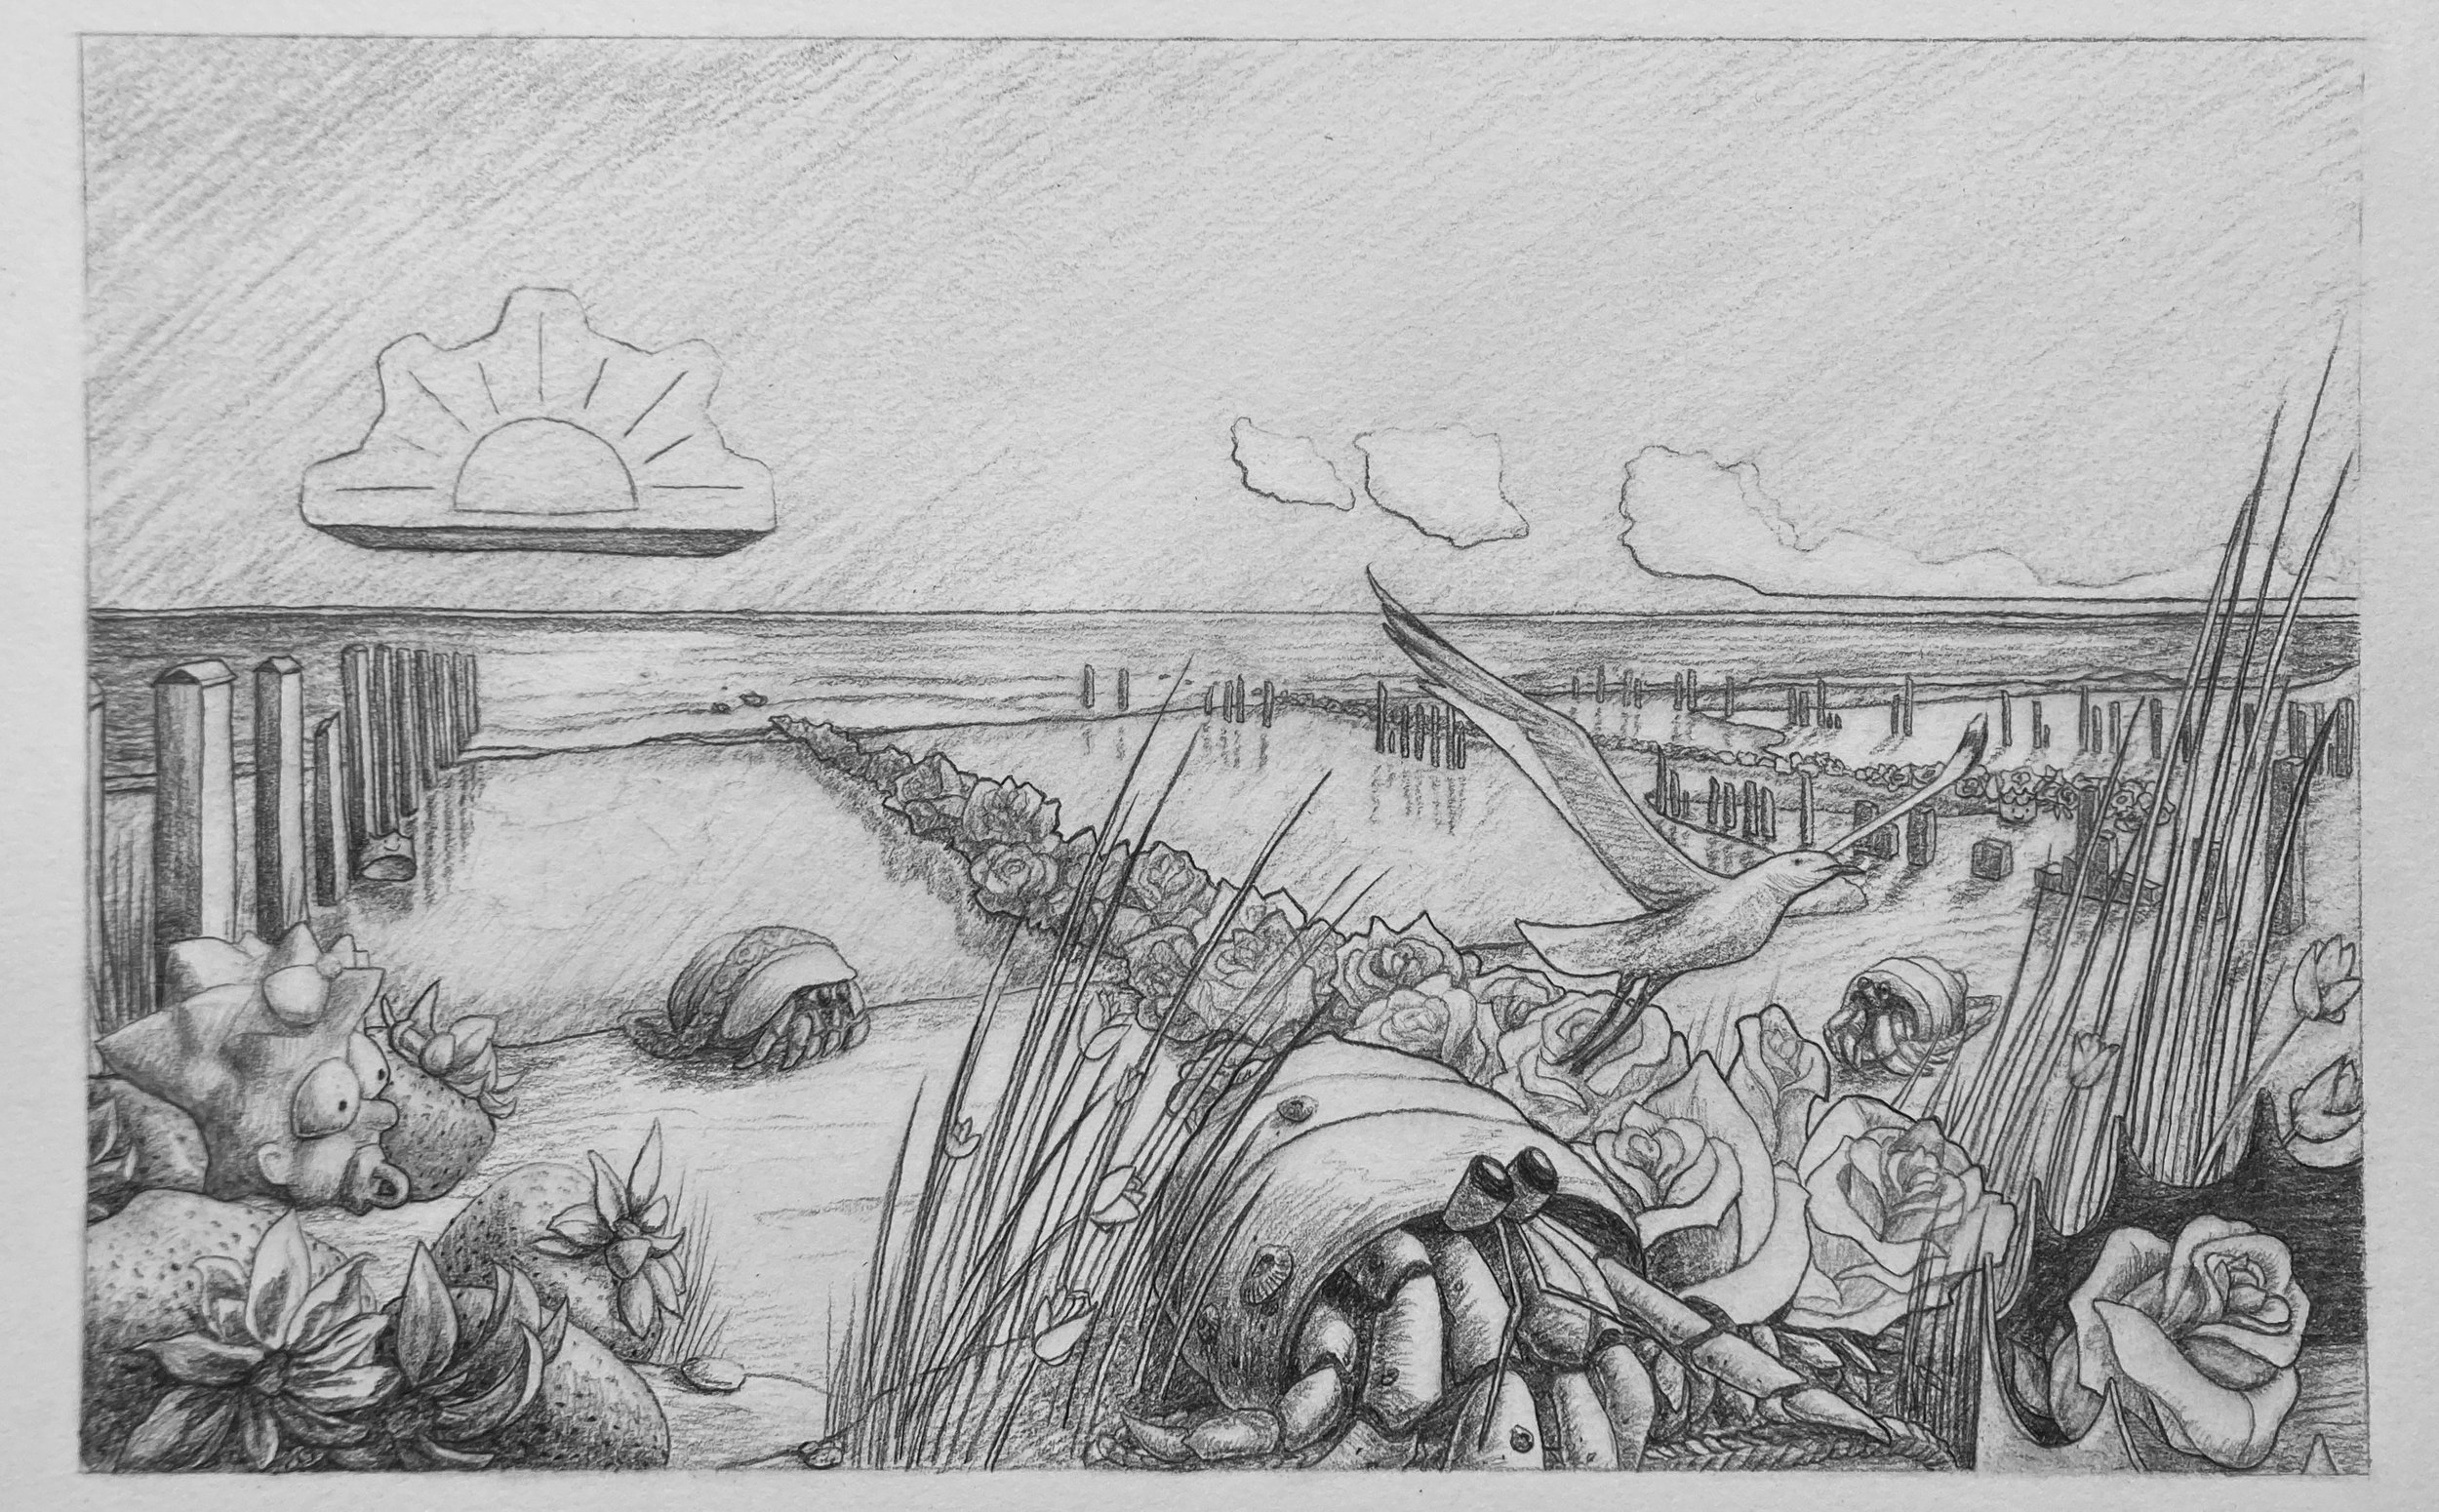
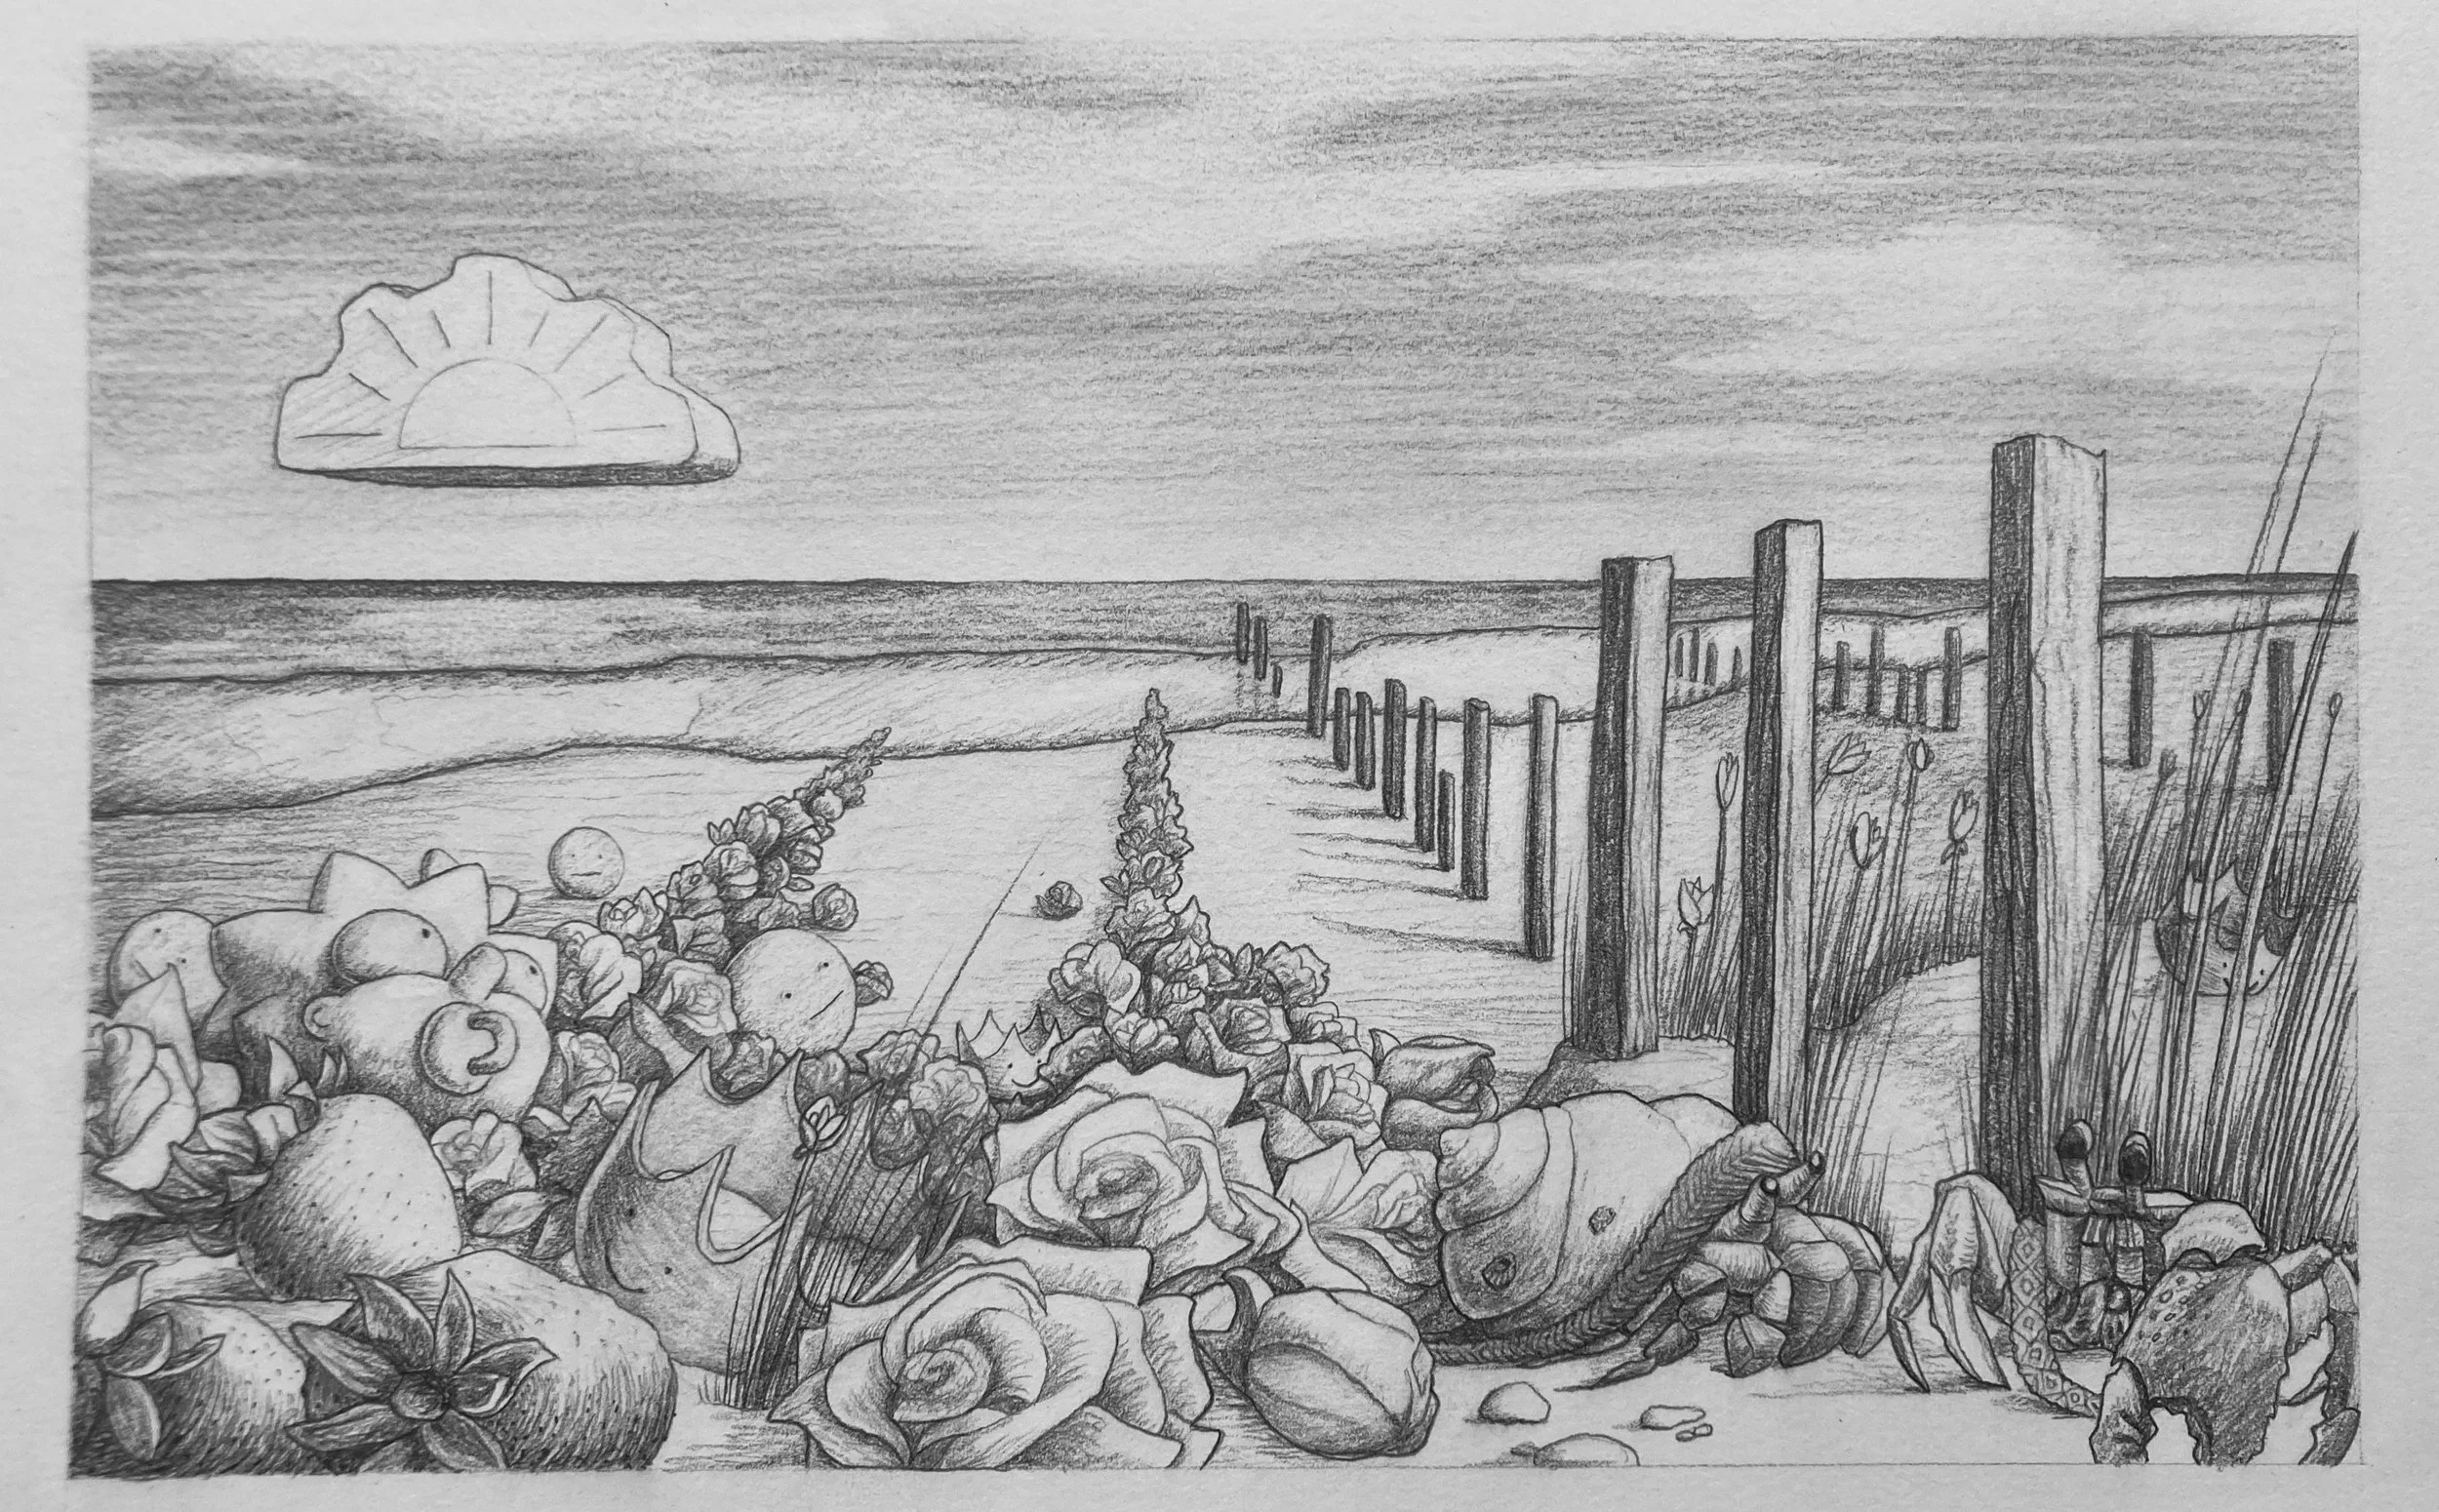
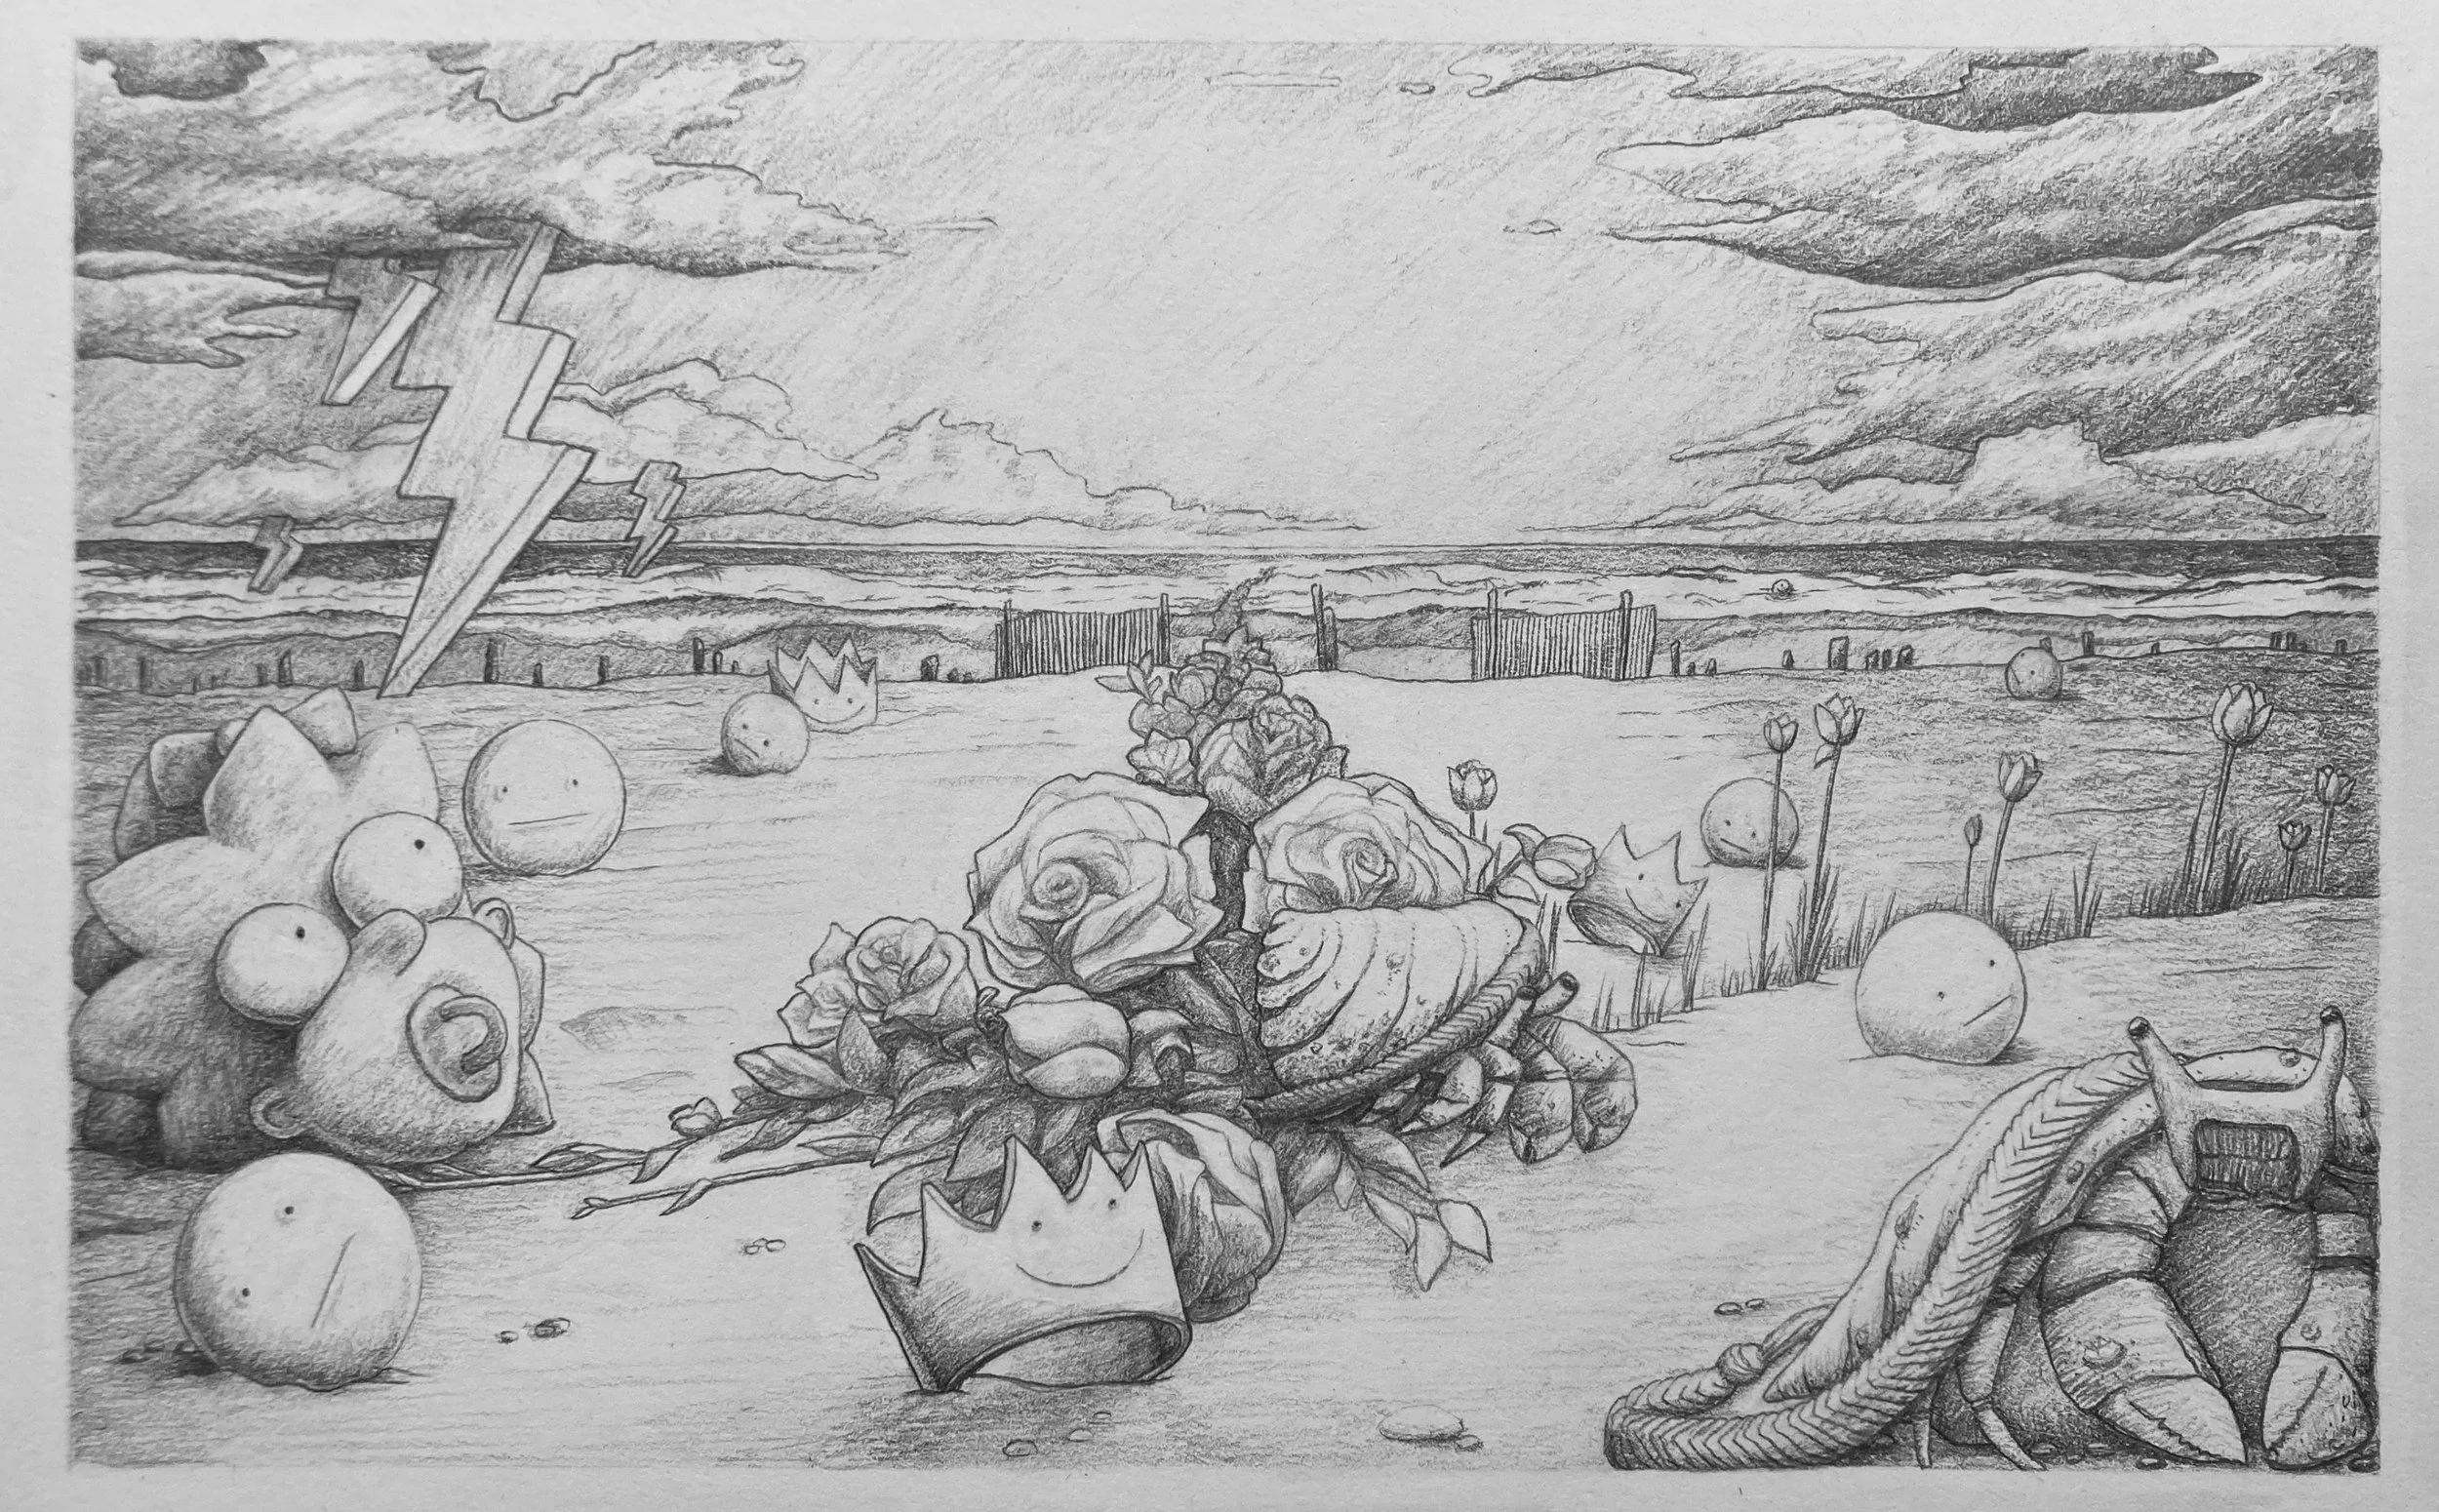
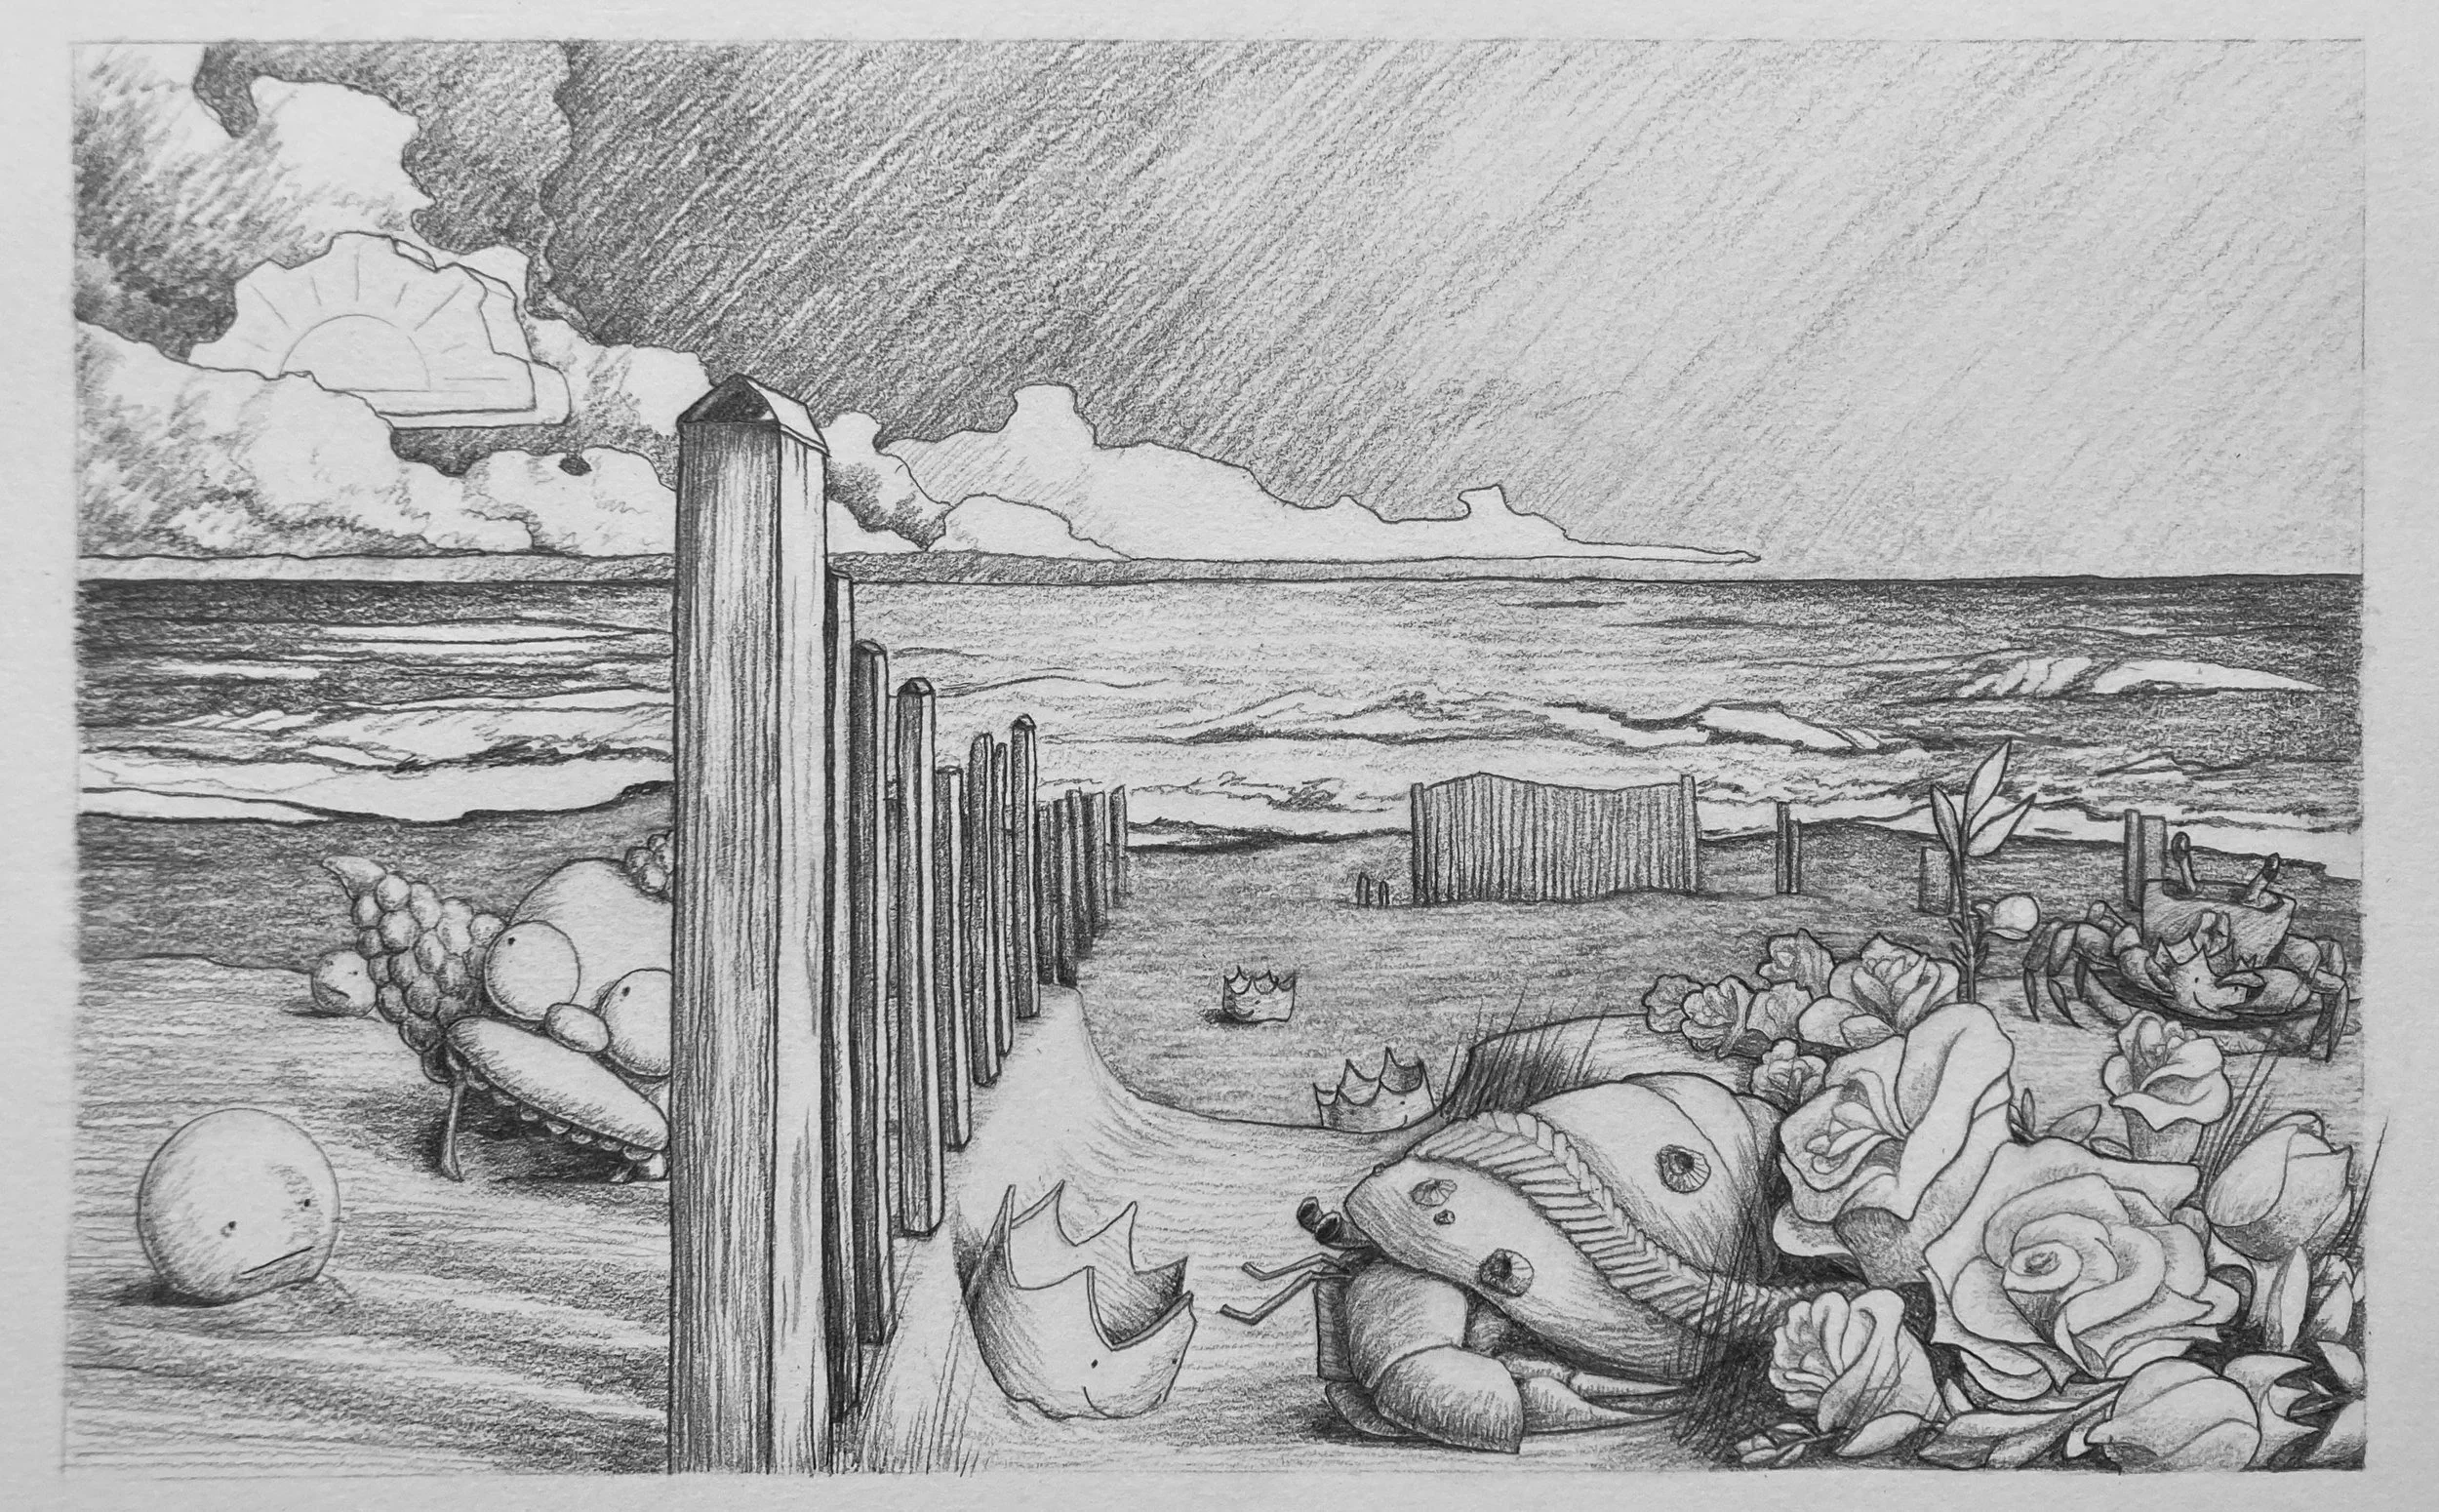
Ruby was thirteen when Covid hit. Living in Brooklyn with her family, she had just entered a new stage of independence - riding the subway on her own and running around the city with her friends. Lockdown clipped all our wings, but was especially stifling for this age group.
In the Spring of 2020, her only contact with friends was through her phone.
Ruby self-selected the information we collected. Some of her questions centred around routine… did she eat breakfast? Did she get her work done? Others focussed on connection and how she was feeling. Choosing her own information for her project was as central to the process as sitting for a portrait.
-
Interviewing Ruby about her responses, I could tell that she had good insight for a person so young. She patiently persevered though all of my questions, though I suspect it felt a little like homework.
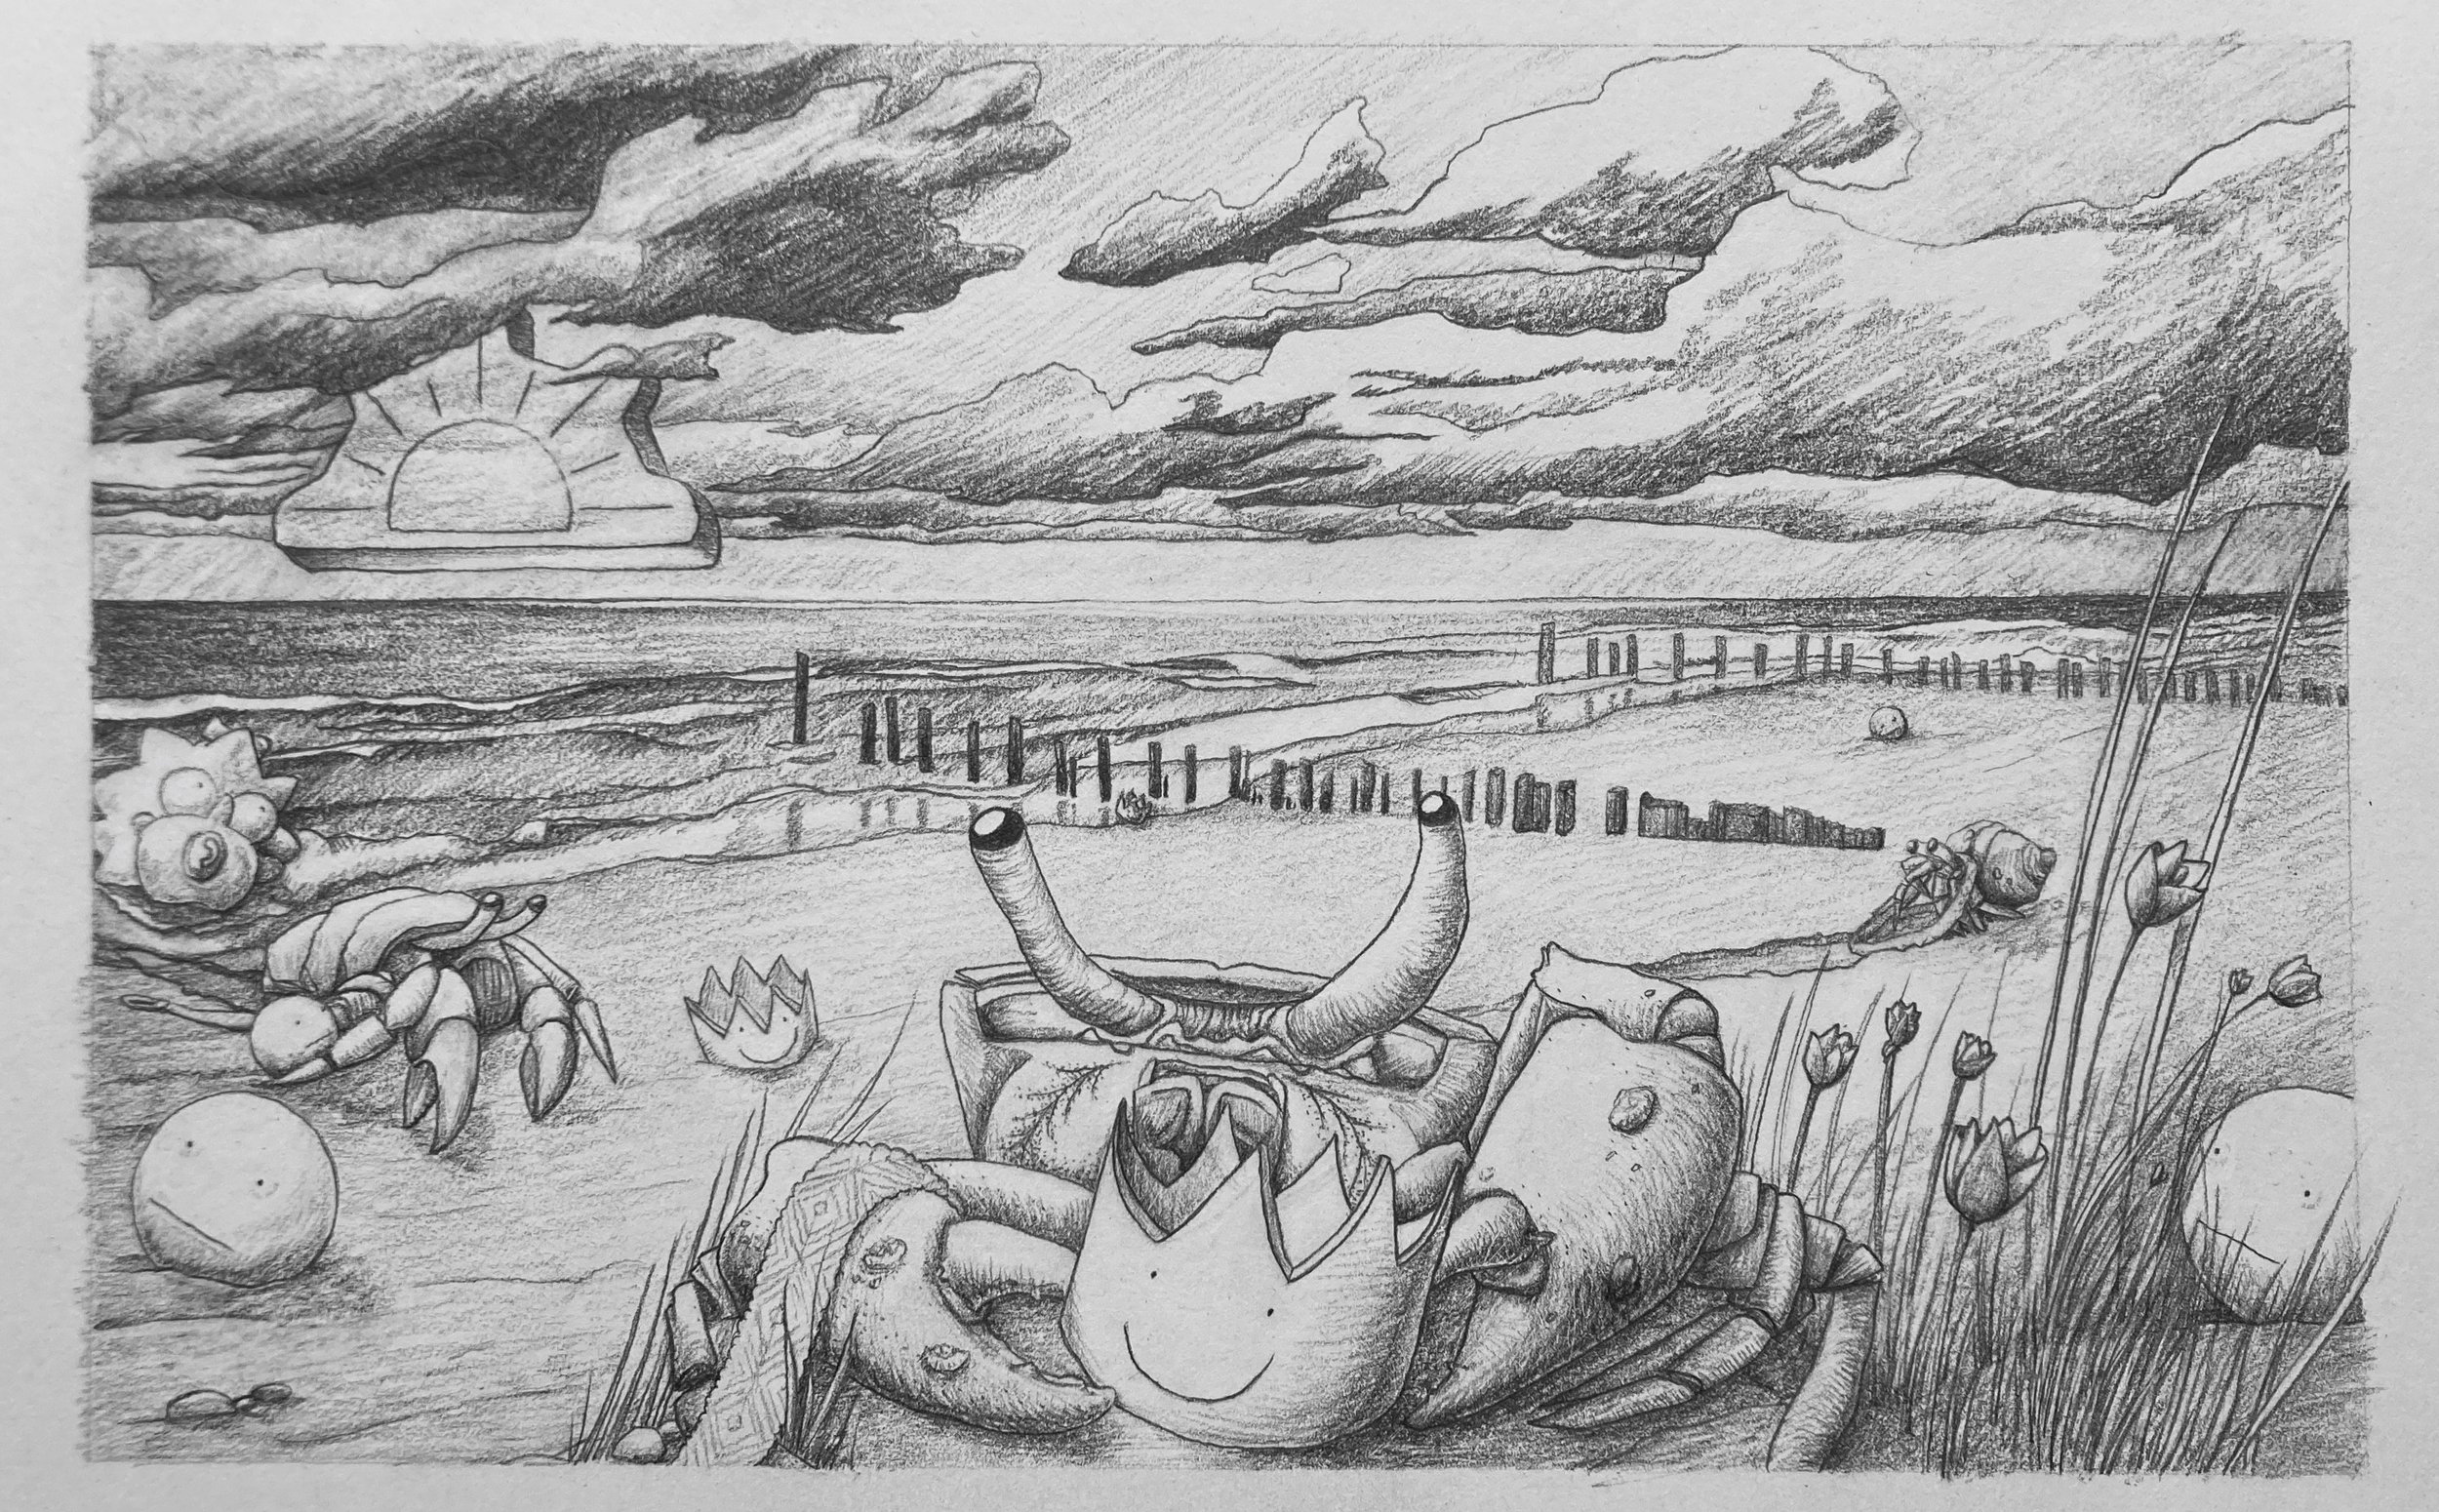
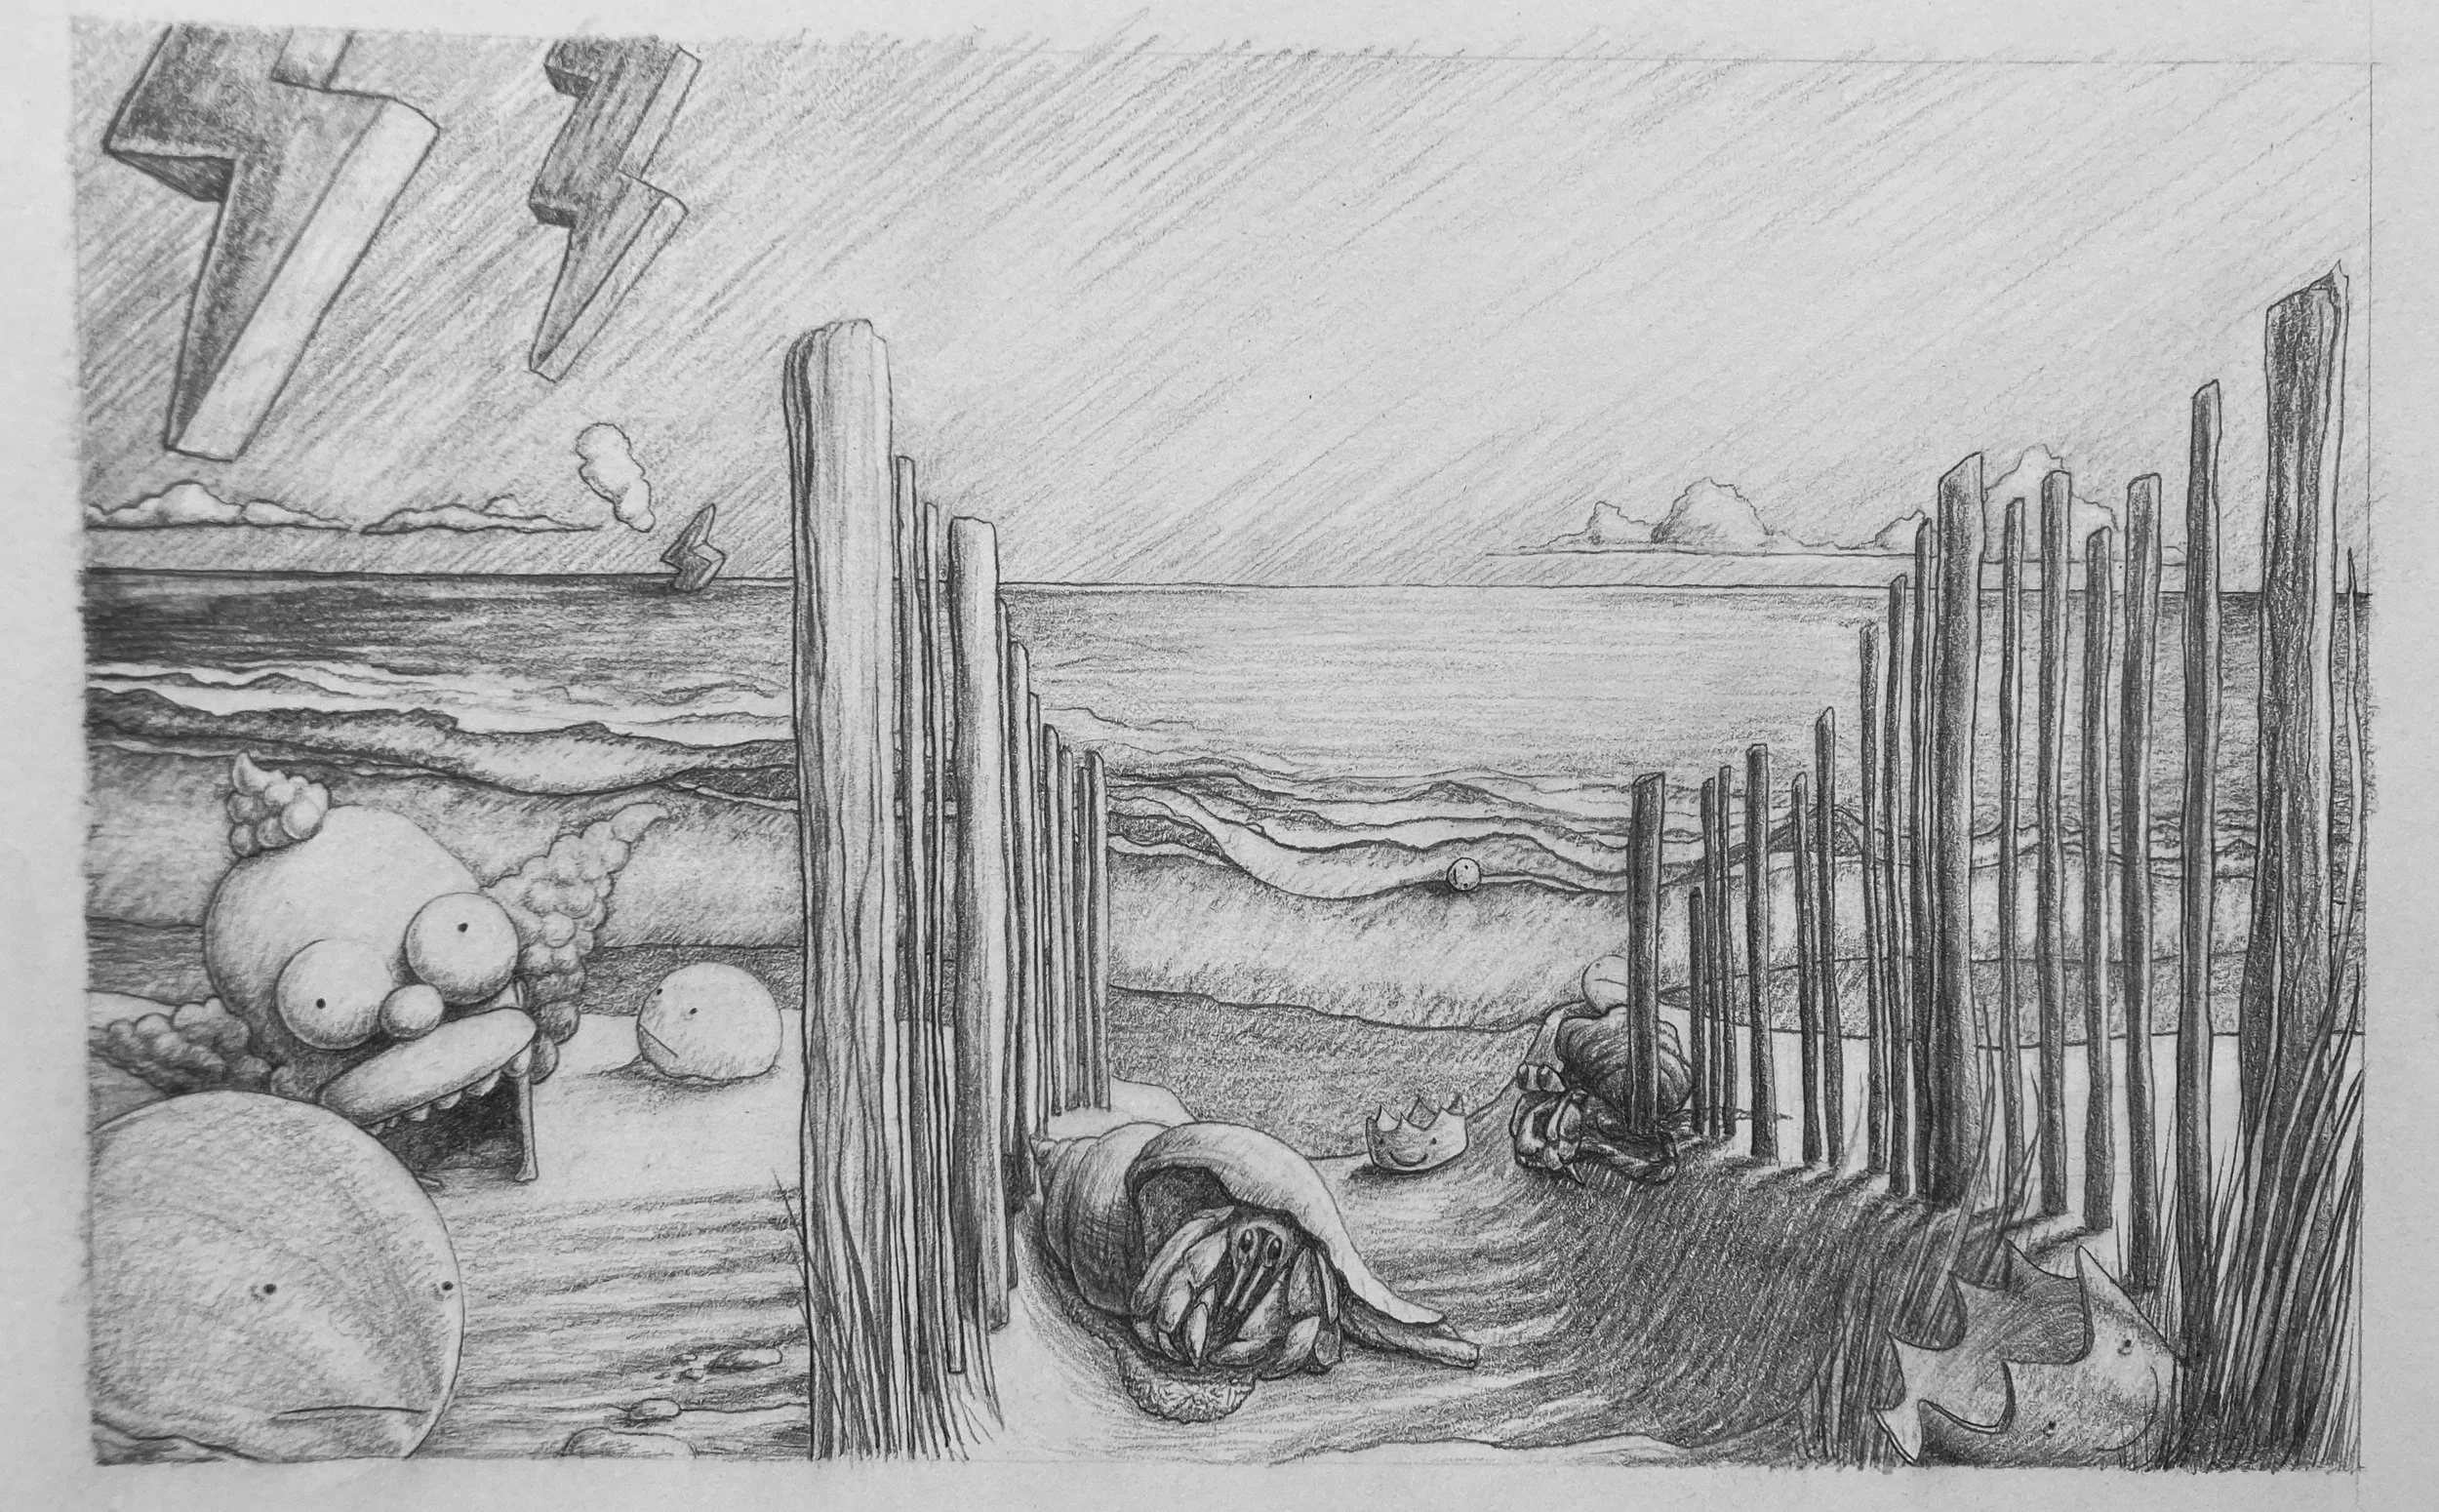
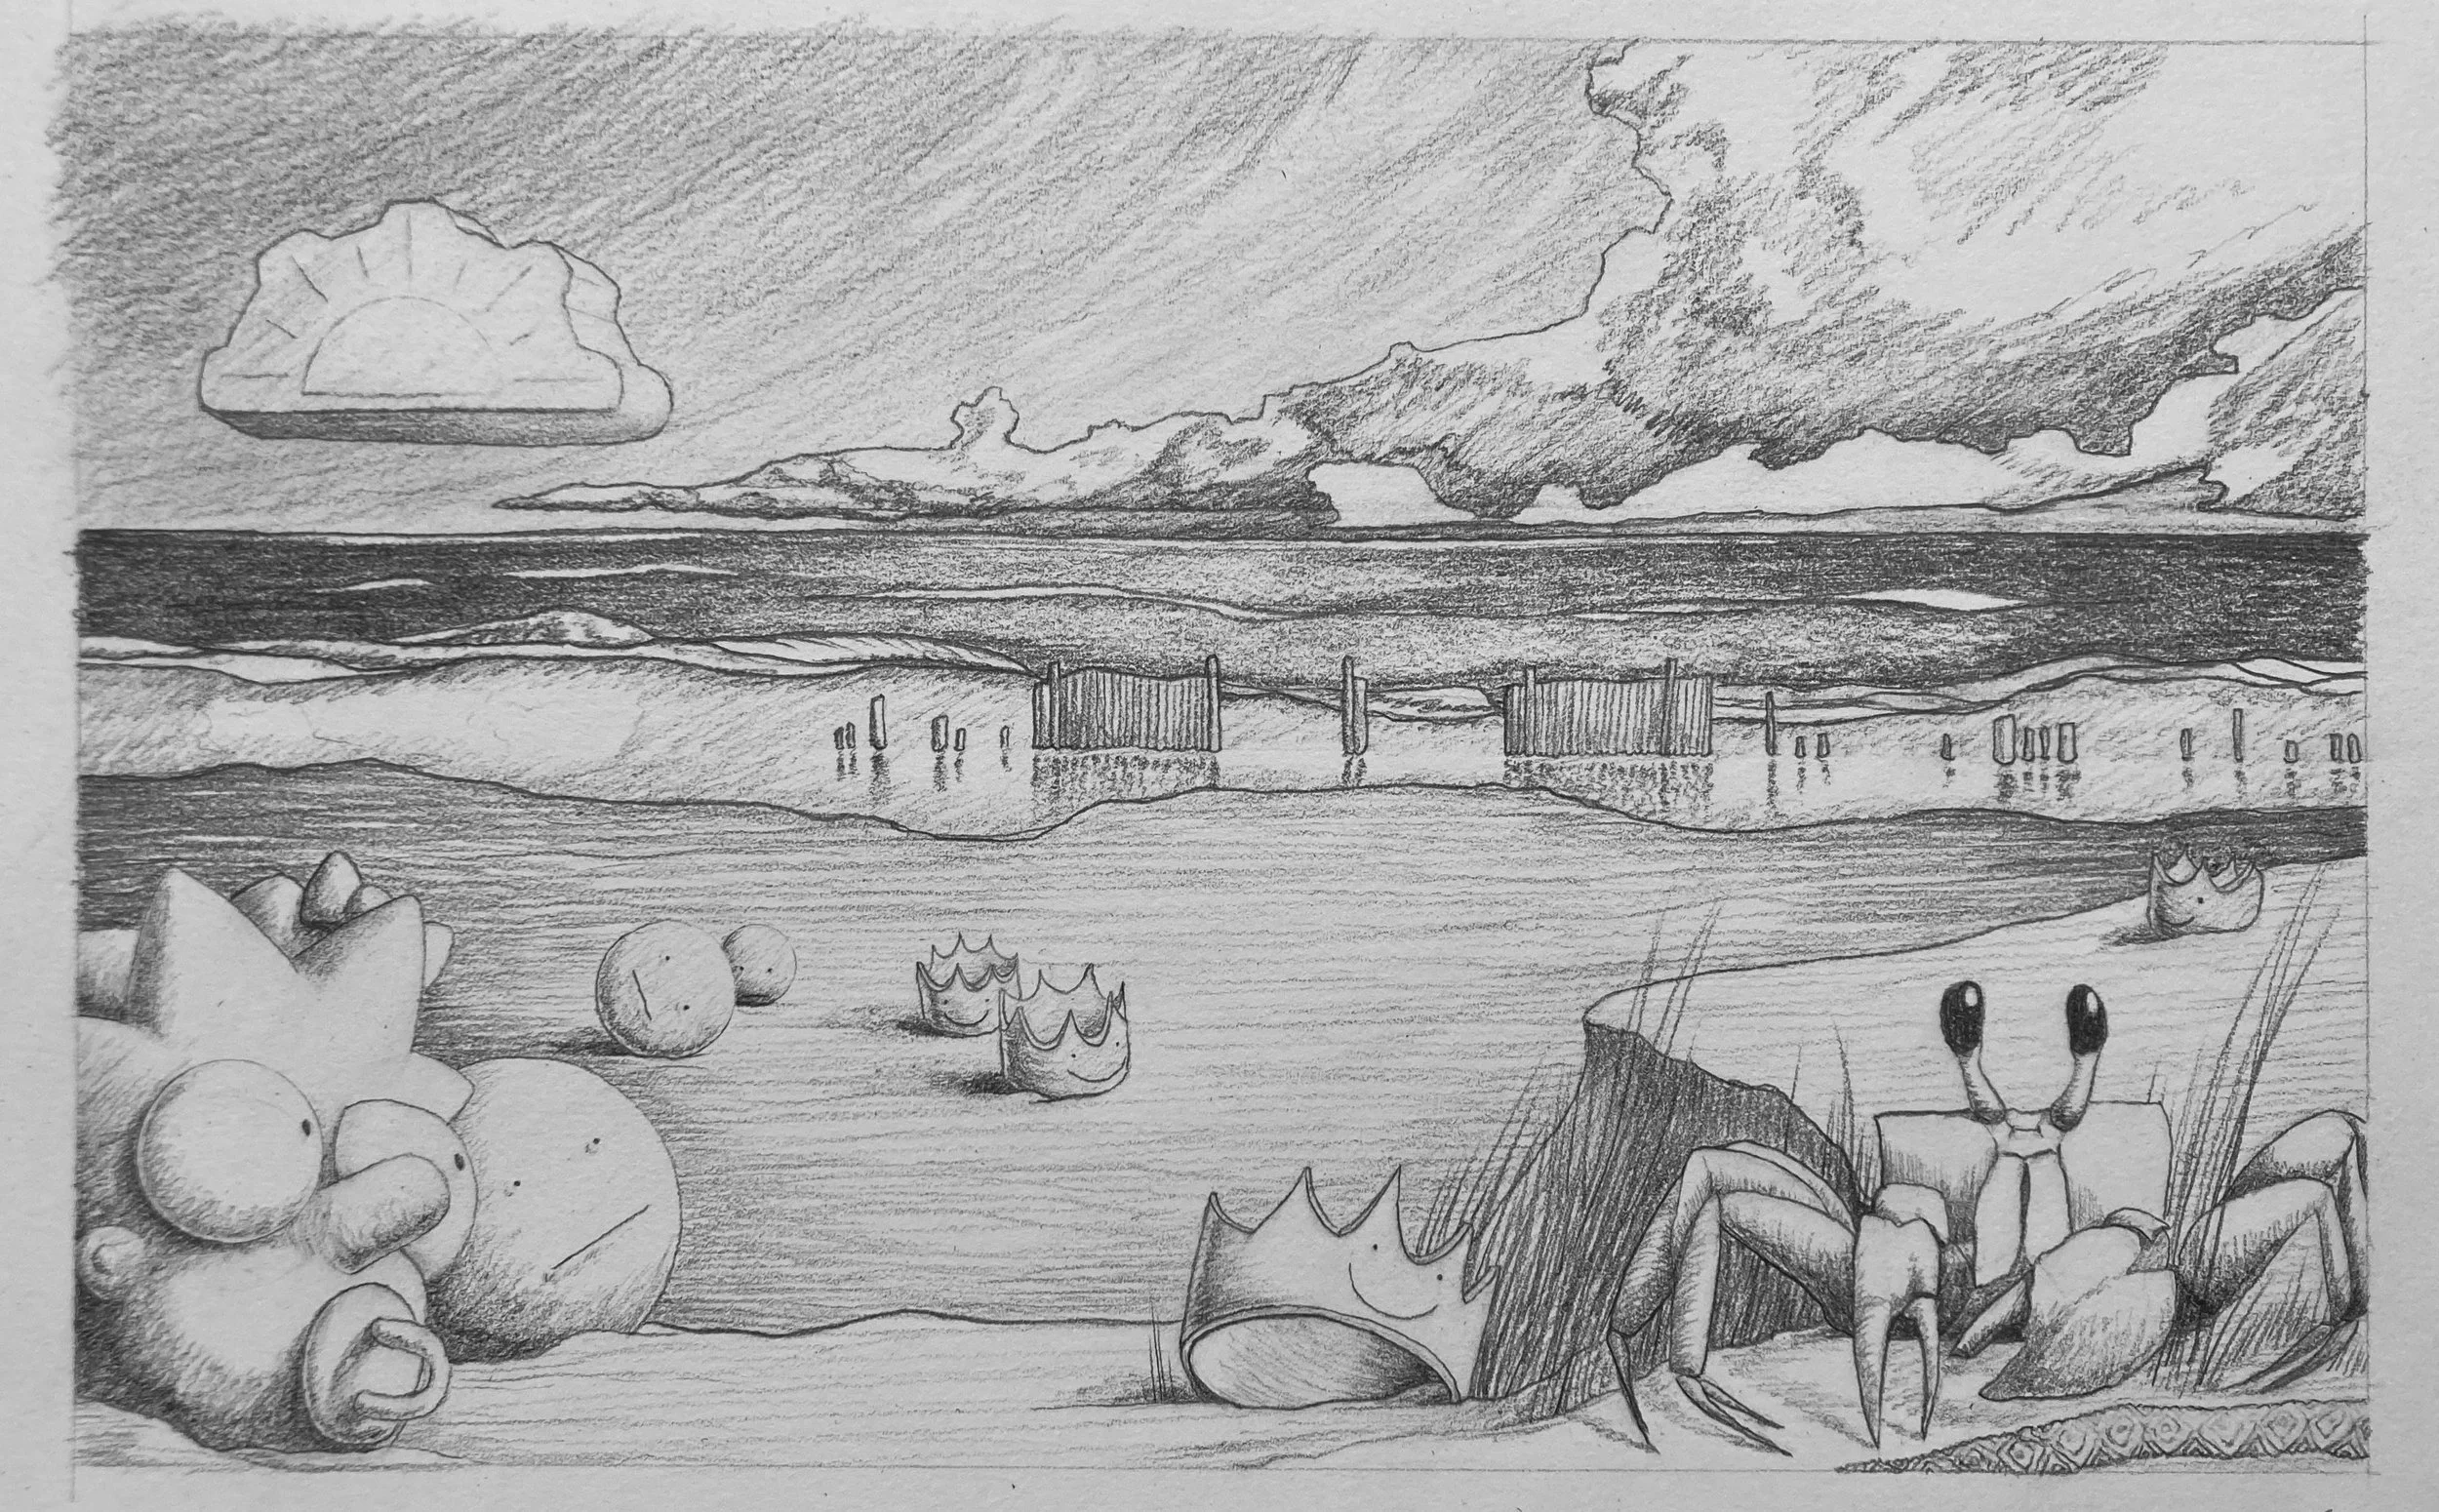
Ruby’s favourite place was the beach. I’d spent time with she and her family at Breezy Point in New York and decided that this should be her stage. The windswept Atlantic beach made a great stage for the other visual elements we chose. Ruby was really into The Simpsons. It made sense to apply Krusty to days when she hadn’t washed her face, and baby Maggie to days when she had.
She sent me pictures of things she liked: stickers and surf stuff, roses and friendship bracelets. I made a point of incorporating as many of these elements as I could into the drawings. It was important to me that she feel like this landscape belongs to her.
When I sent her the first of the seven drawings, she ran downstairs and showed it to her mom right away. Her mom told me, “she never tells me anything these days, so that’s a big deal.”
Ruby / week of April 15, 2020/ graphite on paper, 9x6”
Ruby’s Data Key
In Progress
Jet Brooklyn, NY
Deb Long Island City, NY
Pauline Manchester, UK
Devo Creston, BC


